Gold is heading into the Federal Reserve’s September meeting with a very different macro backdrop from just a few weeks ago. The market has moved from debating whether the Fed might hike to largely pricing the hike as the base case, and gold’s recent price action reflects that shift.
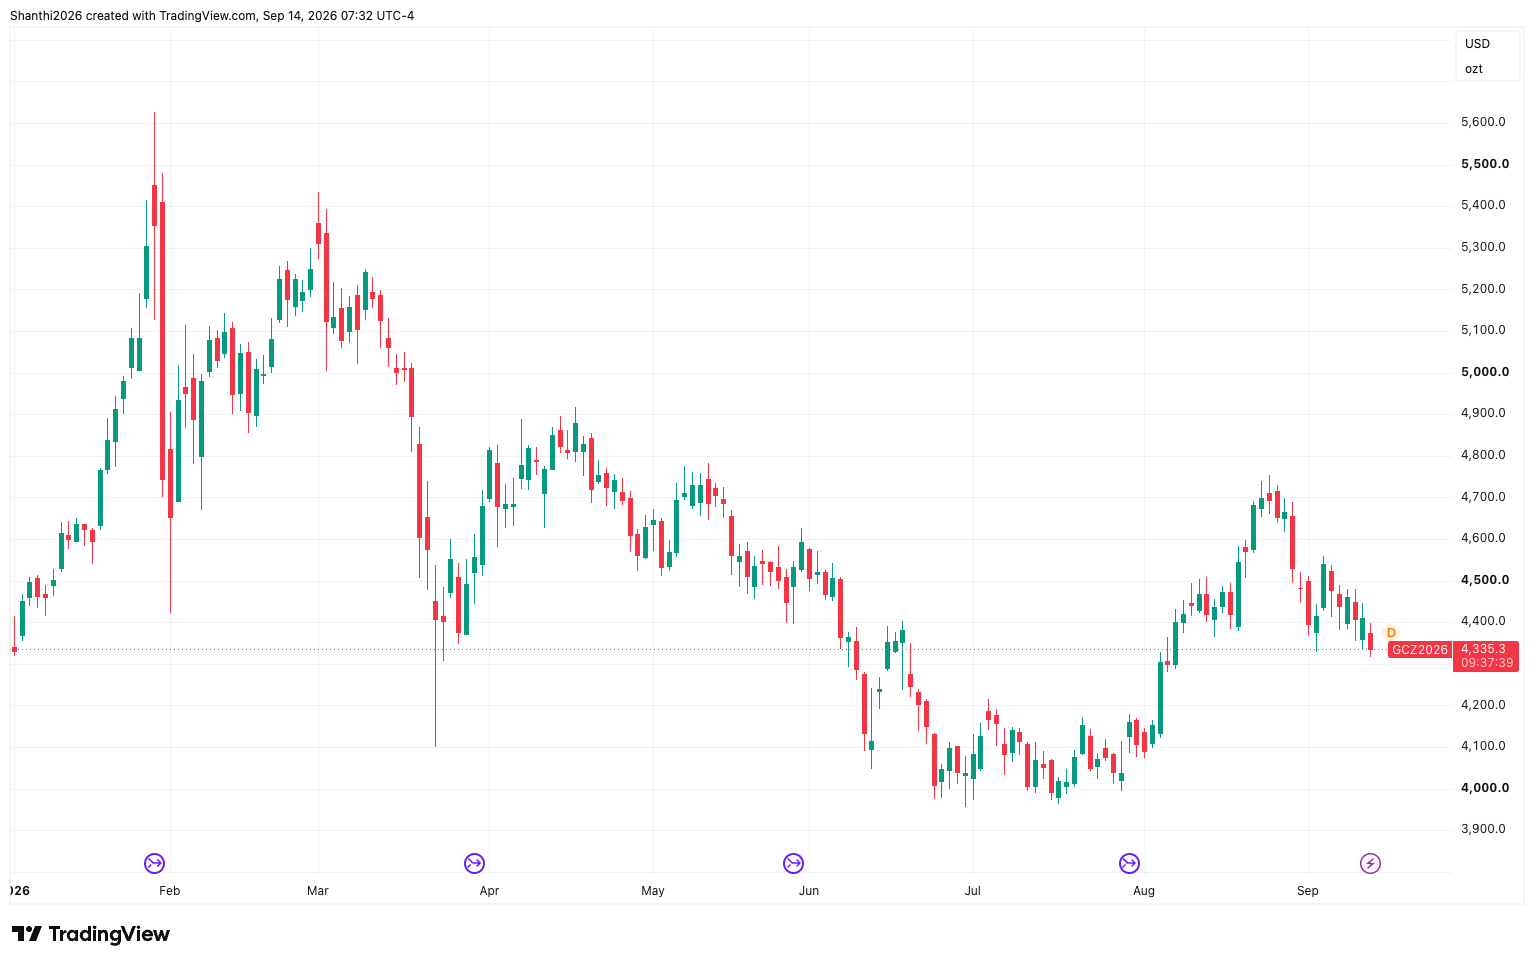
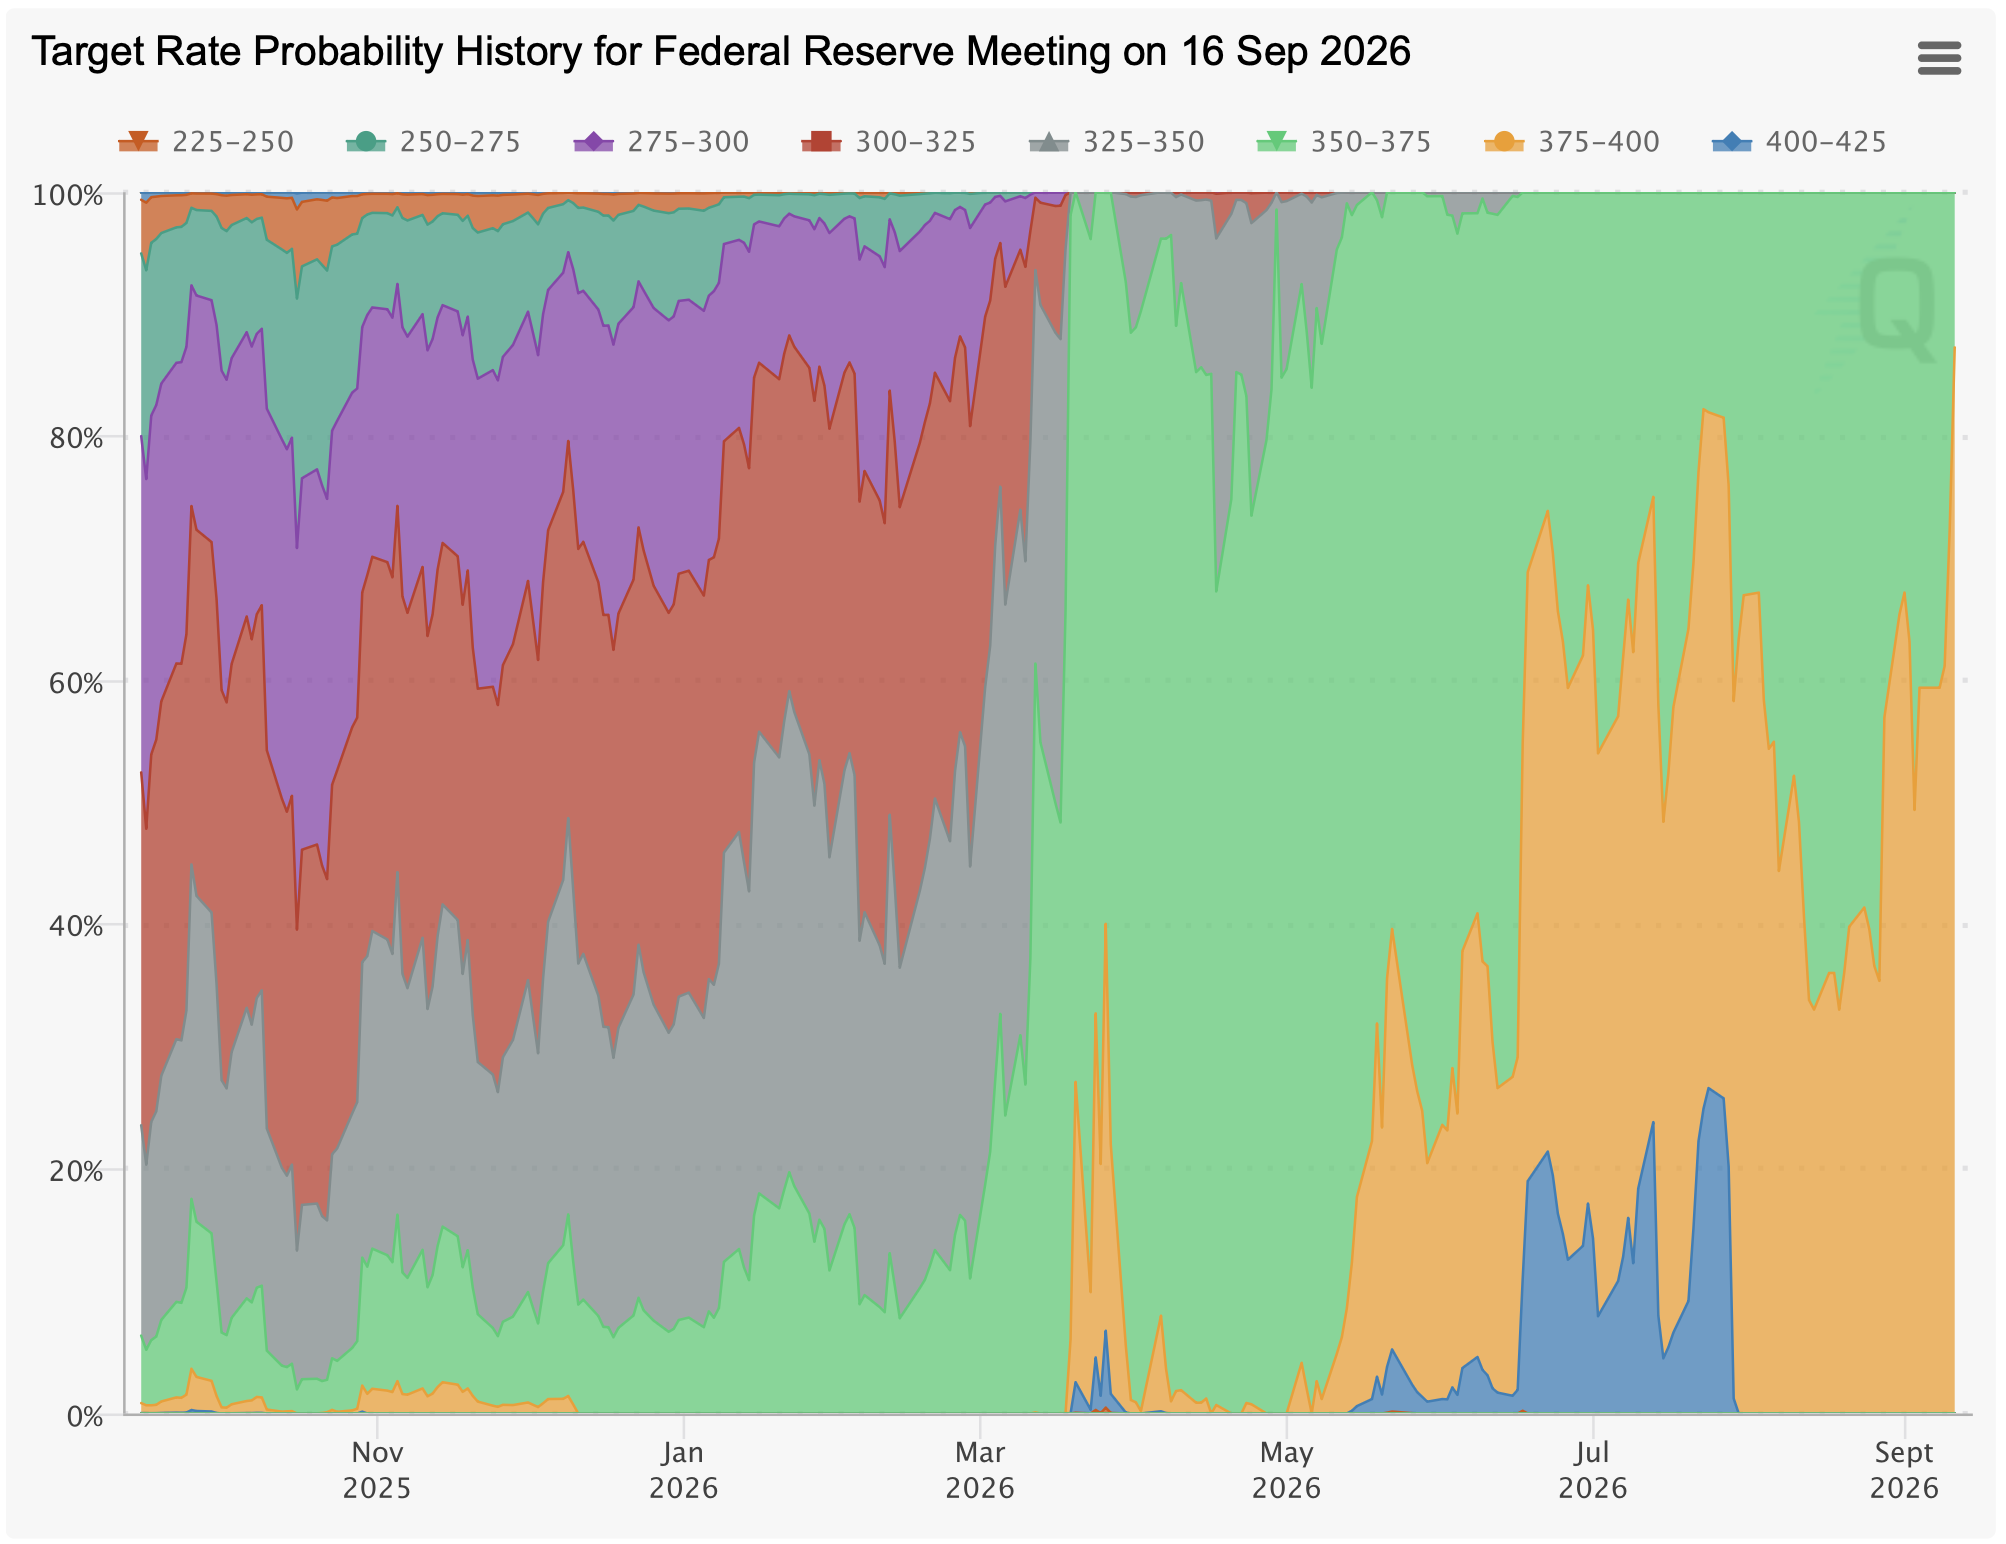
Futures markets were pricing an 87% probability of a 25-basis-point hike as of Monday, up from 67% previously. That repricing has helped push gold lower. Gold futures fell about 1.74% Monday to around $4,332, extending a decline that began after the latest inflation and employment data strengthened the case for tighter policy.
Gold’s 2026 rally has already been a wild ride
The current weakness needs to be viewed against an extraordinary year for gold.
The metal surged to a record early in 2026, with gold futures reaching an intraday high of $5,586.20 on Jan. 29, before collapsing to $3,963.30 in late June. That nearly $1,623 peak-to-trough swing pushed 30-day realized volatility above 50%.
Gold then staged an equally impressive recovery. After stabilizing around $4,000 in July, bullion surged nearly 10% in August to $4,431.10. ETF buying, futures flows and options activity all contributed to the August rally.
Source: TradingView
The sequence is important: gold rallied when expectations for Fed tightening faded, then began giving back those gains as the market repriced toward a hike.
In mid-August, September hike odds had fallen to just 33% after softer inflation and labor-market data. By early September, stronger employment data had pushed those odds to 58%. After the latest inflation data and renewed oil surge, they have climbed to roughly 90%.
Historical Target Fed Funds Rate Probability for Sept. 16 Meeting
Source: CME Group
The latest selloff is about rates but oil is making it worse
The catalyst isn't simply the Fed meeting itself. It is the combination of higher inflation expectations, rising oil prices, Treasury yields and a firmer dollar.
August CPI showed headline inflation at 3.4% year over year, while core CPI rose 0.3% on the month. At the same time, the latest oil shock is threatening to extend inflationary pressure rather than allow policymakers to look through it.
That creates an unusual environment for gold. Rising commodity prices would ordinarily strengthen gold's inflation-hedging appeal, but if they force the Fed to keep tightening, higher real yields and a stronger dollar can overwhelm that benefit in the short run.
The scale of those headwinds makes gold's resilience around $4,300 notable. Ole Hansen, head of commodity strategy at Saxo, said gold is holding just above the key support area despite a combination of unfavorable moves across other markets. Since the U.S. Labor Day holiday, gold has fallen 1.8%, while the December Fed funds futures contract has declined 15 basis points to imply a year-end rate of 4.08%. Over the same period, the dollar has gained 0.6%, two- and 10-year Treasury yields have risen 22 and 17 basis points, respectively, and Brent crude has surged 10%, adding to inflation concerns.
Hansen said the combination represents significant headwinds for gold, but the relatively modest decline also points to resilient underlying demand that has so far prevented a deeper correction and kept the $4,300 support area intact. In the very short term, however, he cautioned that holding that level is becoming increasingly challenging.
CFTC positioning leaves room for more volatility
The Sept. 8 CFTC report shows why the next move could become particularly violent.
Managed Money held 145,804 long contracts against 10,832 shorts, leaving the category with an outright net long of roughly 135,000 contracts.
That is still a substantial bullish position.
However, the weekly changes show some cooling: Managed Money reduced gross longs by 3,917 contracts, while shorts fell by 2,118. The result was a modest reduction in the net-long position.
More importantly, the broader futures market remains heavily positioned for higher gold prices. That means a sufficiently hawkish Fed outcome could produce long liquidation on top of fresh macro selling, rather than merely a gradual decline.
The opposite is also true. If the Fed hikes as expected but signals that the move is largely a response to temporary energy-driven inflation or that further tightening is not predetermined, gold could find that the most bearish rate repricing has already occurred.
MarketFramework’s Positioning Edge tool shows a strong bullish divergence in Micro Gold futures (MGC) contracts. Profitable traders are running 46.2% long versus unprofitable traders at 37.5% long, a nine-point gap. Given gold’s decline for a third straight week into the FOMC meeting, the bullish lean among skilled traders is noteworthy, implying that they see at least a short-term bounce or a “sell the confirmed hike” reversal once the Fed decision lands, rather than continue to fall.
The real test comes after the hike
This is why Wednesday's decision may be less important for gold than what comes with it.
A 25-basis-point hike is now close to fully anticipated. The bigger market questions are whether the policy statement signals additional tightening, where the new projections place rates, and how Chair Kevin Warsh characterizes the inflation outlook during his press conference.
If the Fed delivers the expected hike but sounds less hawkish than markets fear, gold could see a “sell the rumor, buy the news” reaction.
If Warsh instead emphasizes persistent inflation, rising energy prices and the need for additional restrictive policy, the pressure could intensify through Treasury yields and the dollar.
That leaves gold at an important technical and positioning crossroads. Hansen has recently pointed to the metal's ability to hold key support despite the inflation and rate headwinds, while the broader market is now watching the low-$4,300 area closely.
Gold’s bull story isn't necessarily broken
The broader backdrop is more complicated than simply “higher rates are bearish for gold.”
Gold's 2026 rally has been supported by ETF demand, central-bank buying, geopolitical uncertainty and concerns surrounding fiscal and monetary policy. The World Gold Council reported that global gold ETFs saw strong inflows in August, while COMEX net managed-money exposure also increased substantially during the rally.
That makes the current decline better characterized as a collision between gold's structural bullish forces and a suddenly hawkish monetary-policy repricing.
The key question for traders is therefore not whether the Fed hikes — the market already largely expects that. It is whether gold can absorb the hike without breaking its broader recovery structure.
If gold holds around $4,300 despite a hawkish Fed, the market could interpret that as evidence that the rate-hike story is already priced in. A decisive break below that area, however, would suggest that the heavy speculative long positioning still has room to unwind.


