The U.S. dollar is entering October with renewed momentum, with the Dollar Index briefly crossing 102 and EUR/USD falling below 1.13 for the first time since May 2025. The move comes despite softer-than-expected U.S. inflation that has reduced near-term Federal Reserve rate-hike expectations.
US Dollar Strength Is More Than a Fed-Hike Trade
The dollar's move above 102 is being driven by a combination of higher U.S. Treasury yields, resilient U.S. economic activity, renewed inflation concerns and broad euro weakness, rather than simply a repricing of October Fed-hike odds.
The 10-year Treasury yield has climbed to its highest level since 2002, while the 30-year yield has also reached multi-decade highs. The bond sell-off has been fueled partly by renewed energy-related inflation concerns and fiscal pressures.
That is important because the dollar has remained firm even after softer August PCE inflation reduced expectations for an October Fed hike. The market is therefore responding not just to the expected policy rate, but to the broader yield advantage of U.S. assets.
At the same time, incoming activity data remain supportive. ISM manufacturing stayed firmly in expansion at 54.5, while employment rose to 52.7 and prices paid jumped to 77.9 from 71.1. Initial jobless claims also fell to 197,000, pointing to continued labor-market resilience.
Euro Weakness Amplifies the DXY Move
The euro is particularly important because it carries a 57.6% weighting in the Dollar Index. That means a sharp EUR/USD decline can lift DXY substantially even without an equivalent move across every major dollar pair.
EUR/USD has now fallen below 1.13, reaching its lowest level since May 2025. The euro is facing its own headwinds from European energy exposure, higher borrowing costs and fiscal concerns, particularly in France.
This makes the euro's decline more than a side story for DXY: when EUR/USD breaks major support, it becomes a direct mechanical and directional driver of the Dollar Index.
6E Positioning Confirms Strong Euro Bearishness
MarketFramework's Top Traded Contracts data reinforce the downside pressure in the euro.
The 6E Euro FX contract has a 7-day Strong Short lean, with +$4.7K in weekly P&L. Today's positioning is even more one-sided: 0% long and 100% short, with today's P&L at +$5.9K, accounting for the entire weekly gain.
The interesting wrinkle is that 75% of winning traders are long. That suggests profitable trades have included countertrend euro longs, but the overall positioning has nevertheless remained overwhelmingly short. In other words, the tool is signaling strong directional bearish positioning in 6E even though some of the successful trades have come from fading the decline.
That positioning aligns with the fundamental picture: euro weakness is currently reinforcing the dollar's advance, while the extreme short positioning also creates a potential source of volatility if EUR/USD stages a sharp reversal.
Strong US Data Complicate the Fed Picture
The dollar's strength is notable because markets have recently reduced the probability of an immediate Fed hike.
August inflation came in softer than expected, prompting traders to cut October hike expectations sharply. New York Fed President John Williams also said the Fed has time to assess incoming data, pushing the market-implied probability of an October hike below 50%.
But Thursday's data showed that the U.S. economy remains resilient. Initial jobless claims fell to 197,000, remaining below 200,000 for a third consecutive week, while manufacturing surveys showed strong activity and rising input-price pressures.
That creates a potentially important tension for the dollar: the Fed may have less urgency to hike in October, but the U.S. economy is not yet sending a clear signal that monetary policy can turn less restrictive.
September Payrolls Are the Next Test
Friday's September employment report is therefore the next major catalyst for both the dollar and Fed expectations. The report is scheduled for Oct. 2, with consensus estimates around 89,000 payroll gains and a 4.1% unemployment rate.
A stronger-than-expected jobs report could reinforce the view that the economy can withstand restrictive policy and potentially revive expectations for another rate increase. A weak report would strengthen the case for patience and could challenge the dollar's recent breakout.
NFP Scenario Analysis for DXY
| NFP outcome | DXY |
|---|---|
| >130K job gains + 4-4.1% jobless rate | bullish; sustained move above 102 |
| 89K-130k + 4.1% Jobless rate | positive; holding above 102 is key |
| 70K-85K + 4.1% jobless rate | choppy, vulnerable near 102 |
| <70K+ >4.2% jobless rate | bearish, rejection at 102 |
What the Dollar Breakout Means for Markets
The move above 102 puts the DXY at an important technical and psychological level. Holding above 102 would reinforce the recent bullish momentum, while a failure to sustain the breakout could leave the index vulnerable to profit-taking, particularly if payrolls disappoint.
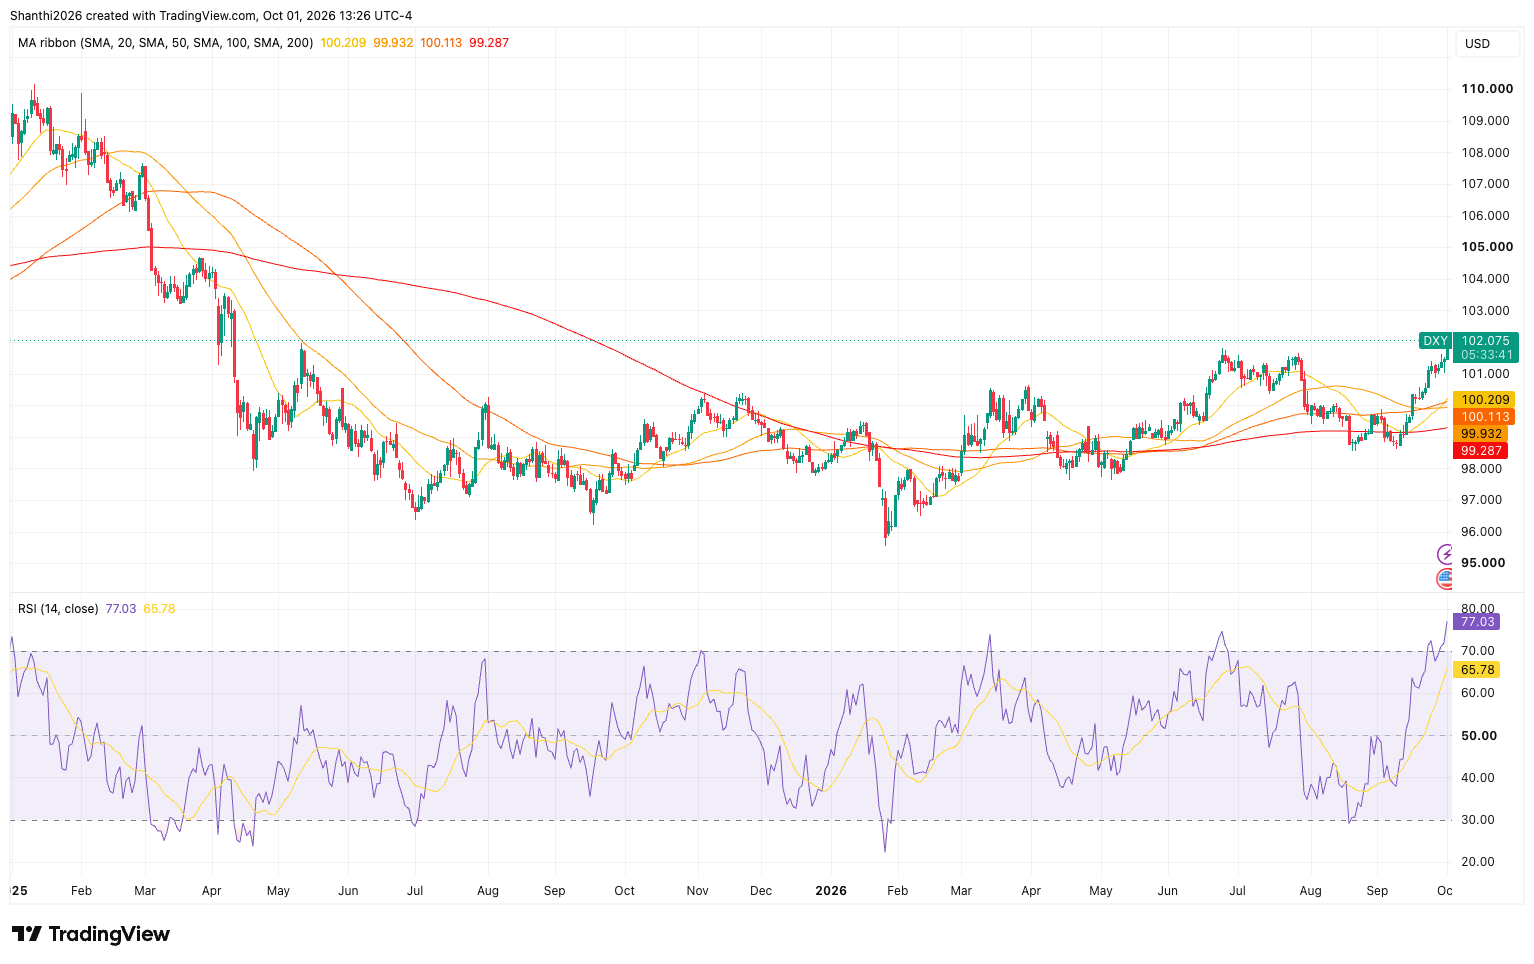
On the daily chart, DXY exhibits strong bullish momentum, breaking above multi-month consolidation levels near 101.00 to reach 102.075. The price is trading well above its entire moving Average ribbon (20, 50, 100, and 200 SMAs), which are stacked in a bullish order above 99.28. However, the daily RSI (14) has breached overbought territory at 77.03, signalling extreme upside stretch and increasing the probability of a short-term pause or mean-reversion pullbacks toward the breakout zone around 101.00–100.20.
Source: TradingView
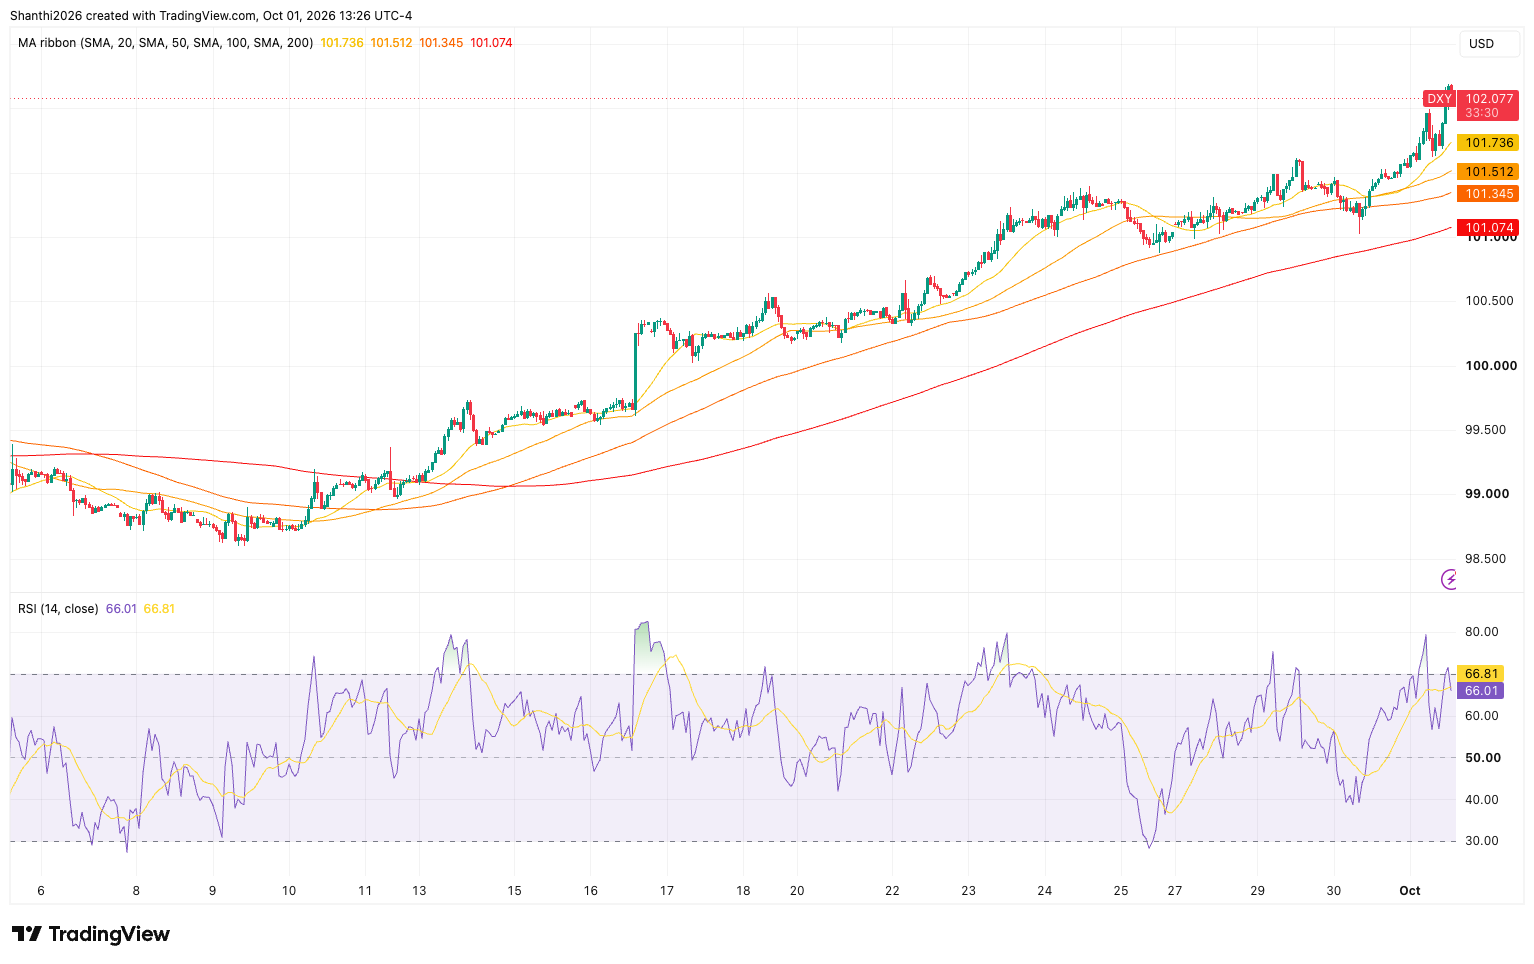
The lower timeframe chart reinforces this established intraday uptrend, showing price riding the 20-period moving average (101.736) after a sharp rally off late-September lows near 98.50. Key short-term dynamic support rests along the moving average ribbon between 101.73 and 101.35, with structural baseline support at 101.07 (200 SMA).
Source: TradingView
While the hourly RSI has cooled slightly to 66.01 following a peak above 80, the overall multi-timeframe outlook remains firmly bullish, favoring buy-on-dip setups above 101.00 while cautioning against chasing high-level breakouts without consolidation.
For broader markets, a stronger dollar and elevated Treasury yields create a mixed backdrop. They can tighten financial conditions, pressure commodities priced in dollars and increase the headwind for multinational companies. Higher yields can also weigh on long-duration equity valuations, particularly if strong economic data cause rate expectations to rise again.
For now, the market is balancing a strong dollar, elevated yields and resilient U.S. activity against softer inflation and reduced October hike expectations. September payrolls could determine which side of that equation dominates the next leg of the dollar move.