
Gold opened the week near $4,280 and sold off steadily through the Asian session. It slipped below $4,200 for the first time since August 5, and the selling carried on as European traders came in.
At the lows, spot gold (XAU/USD) was down over 3% at around $4,142/oz, about $557 below its late-August high of $4,697/oz.
Why Gold Is Falling: Interest Rates
The main driver is the Federal Reserve. The Fed raised rates in mid-September for the first time in three years, to a 3.75%–4.00% range, and signalled that another hike is likely before year-end.
Fed officials have kept up the tough talk since. On Friday, Cleveland Fed President Beth Hammack said policy needs to stay tight to bring inflation down.
Traders now price in about a 70% chance of another hike in October, up from about 55% at the start of last week, according to the CME FedWatch Tool.
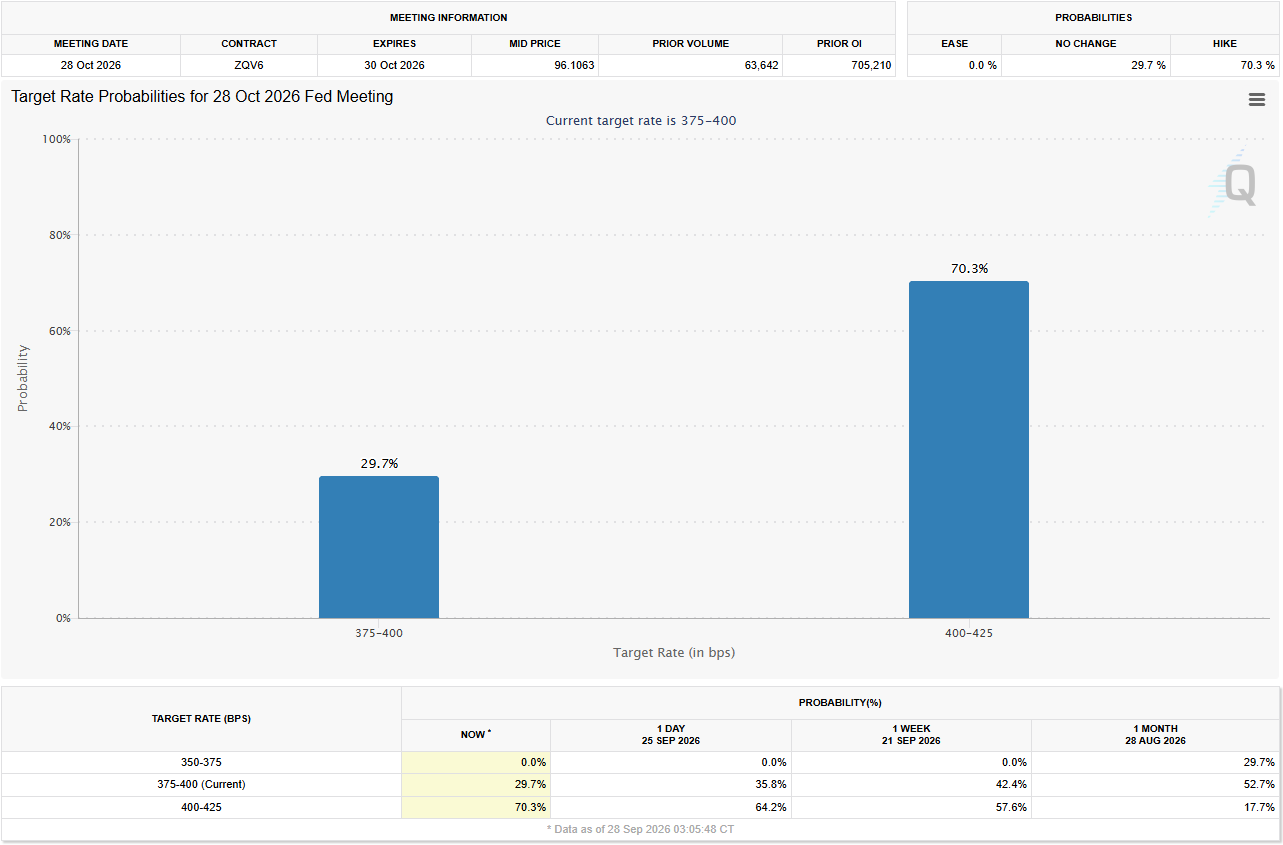
Source: CME FedWatch
Higher US rates are lifting the dollar. With gold is priced in dollars, a stronger dollar is weighing on gold prices. The US Dollar Index is holding above 101.00.
Hormuz Deal Stalemate
Over the weekend, President Trump rejected Iran’s offer to end the fighting and reopen the Strait of Hormuz, and said more strikes were possible before the US midterms.
Oil jumped, with Brent near $106 a barrel in early Asian trade.
But higher oil means a higher inflation risk, and that means more pressure on the Fed to hike. So the Middle East news actually hurt gold through the interest-rate channel.
The safe-haven money went into the US dollar instead of bullion.
What the Charts Say
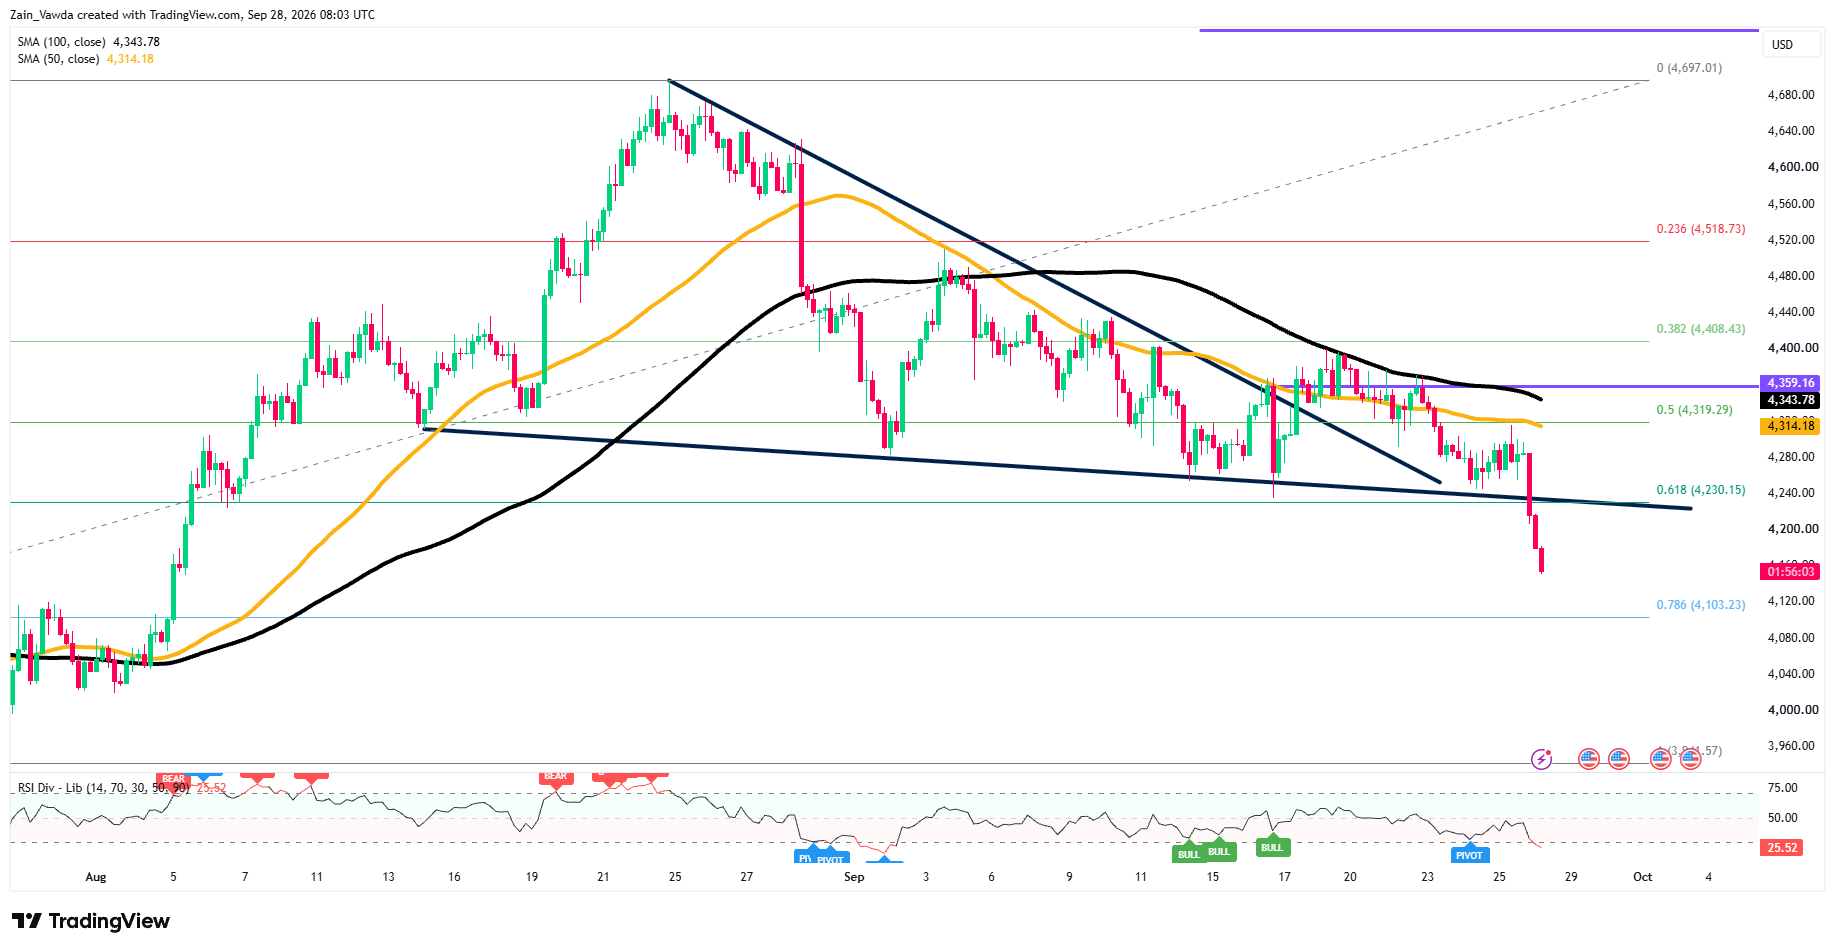
On the four-hour chart, gold has broken two key supports at once. The first is a trendline that has held the lows since mid-August. The second is the 61.8% Fibonacci retracement at $4,230, a level traders use to judge how deep a pullback can go. Both sit around $4,230, which makes that zone the most important line this week.
Price is also below the 50-period and 100-period moving averages ($4,314 and $4,344), a sign the trend has turned lower.
Gold Four-Hour Chart, September 28, 2026
Source: TradingView
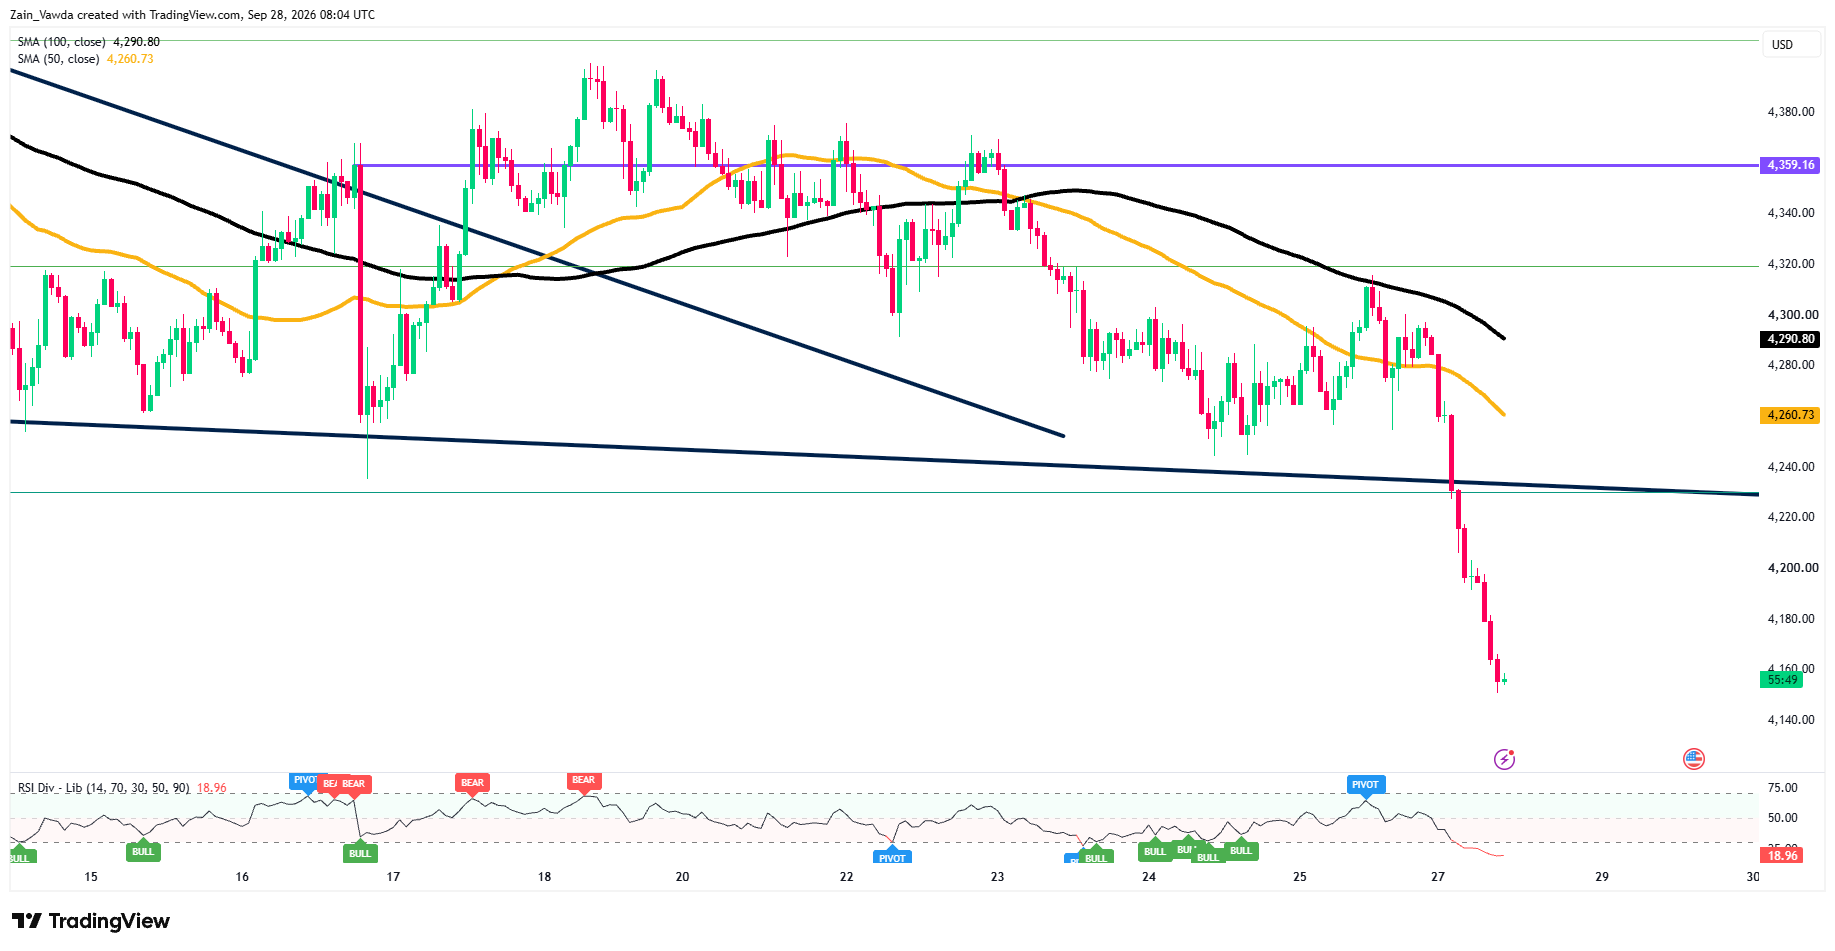
The one-hour chart shows the selling is stretched. The Relative Strength Index (RSI), a momentum gauge that runs from 0 to 100, has dropped to about 19.
A reading below 30 means the market is “oversold”: it has fallen very fast, and short bounces are common. But oversold does not mean the bottom is in.
Gold One-Hour Chart, September 28, 2026
Source: TradingView
Where Could Gold Go From Here?
The nearest catalysts are Fed speeches this week, the US PCE inflation data and final Q2 GDP on Wednesday, and the US jobs report (NFP) on Friday. Any Iran headlines will feed in through oil
Potential Scenario Matrix
| Scenario | Trigger | Path |
|---|---|---|
| Bull | Soft PCE, oil eases, or Iran talks restart | Reclaim $4,230 and hold, then $4,260 and the $4,290–$4,320 zone |
| Base | Oversold bounce, no big surprise in data | Choppy range of $4,150–$4,230; sellers likely to defend $4,230 |
| Bear | Hot PCE or strong NFP lifts October hike odds | Break of $4,150 opens $4,100, then $4,000 and $3,940 |
Trader Positioning Data
Marketframework Positioning Edge Tool data was showing a mild bullish divergence divergence on Gold as last week came to a close.
Keep an eye on the data at the start of the week as this may provide further insights into where the smart money is heading.