
Bitcoin (BTC/USD) is down about 2.5% on Wednesday, trading near $83,800 in the US session. It pushed up to Monday’s high near $87,300 early in the day, but sellers were waiting again. Price then fell through $85,000, the level that had held since Monday’s breakout.
This is the first real wobble in a strong run. Bitcoin has rallied roughly 35% since mid-August and is on track for its first July-to-September winning streak since 2012, according to CoinDesk. The question now is whether this is a healthy pause or the start of a deeper pullback.
Why Bitcoin Is Slipping
Higher rates, stronger dollar. The Fed raised rates last week and its projections point to one more hike this year. On Wednesday, the two-year Treasury yield hit a new cycle high of about 4.79% and the odds of an October hike rose above 53%, per CoinDesk.
The U.S. Dollar Index is near a two-month high. Higher rates make it more expensive to hold assets that pay no interest, like Bitcoin and gold.
Money is rotating. Some traders are taking profits in Bitcoin and moving into smaller coins. Bitcoin Cash jumped 28% after CME Group said it will list Bitcoin Cash futures from October 19.
FxPro’s Alex Kuptsikevich described it as speculative money shifting temporarily into altcoins, a pattern that has previously led to a slowdown in Bitcoin, not a reversal.
A big options expiry is coming. About $15.9 billion of Bitcoin options expire on Deribit on Friday at 08:00 UTC, one of the largest expiries of the year.
Deribit’s CEO Luuk Strijers said dealer hedging likely added fuel to the rally through $80,000–$87,000. Once those contracts expire, that support fades and price swings can get bigger.
The “max pain” level, where option buyers lose the most, sits far lower at $75,000.
The Bigger Picture Is Still Bullish
The demand story has not broken. US spot Bitcoin ETFs have taken in about $4.6 billion since August 19, turning flows positive for the year, according to Bloomberg data. Monday alone brought in $999 million, the biggest day since October 2025. Pepperstone’s Chris Weston estimates the average ETF holder bought at around $82,000, which could make that area a natural support.
Bitcoin ETF Flows
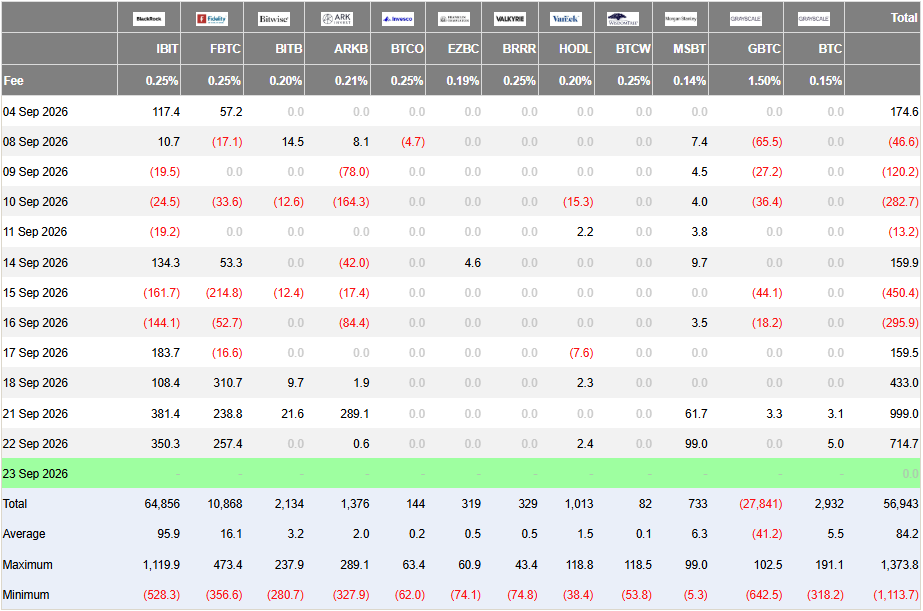
Source: Farside Investors
On-chain firm CryptoQuant says the bull market is confirmed, but it flags the $88,000–$90,000 zone as the next place where short-term traders are likely to cash in profits.
The Chart: Uptrend Intact, Short-Term Momentum Cracked
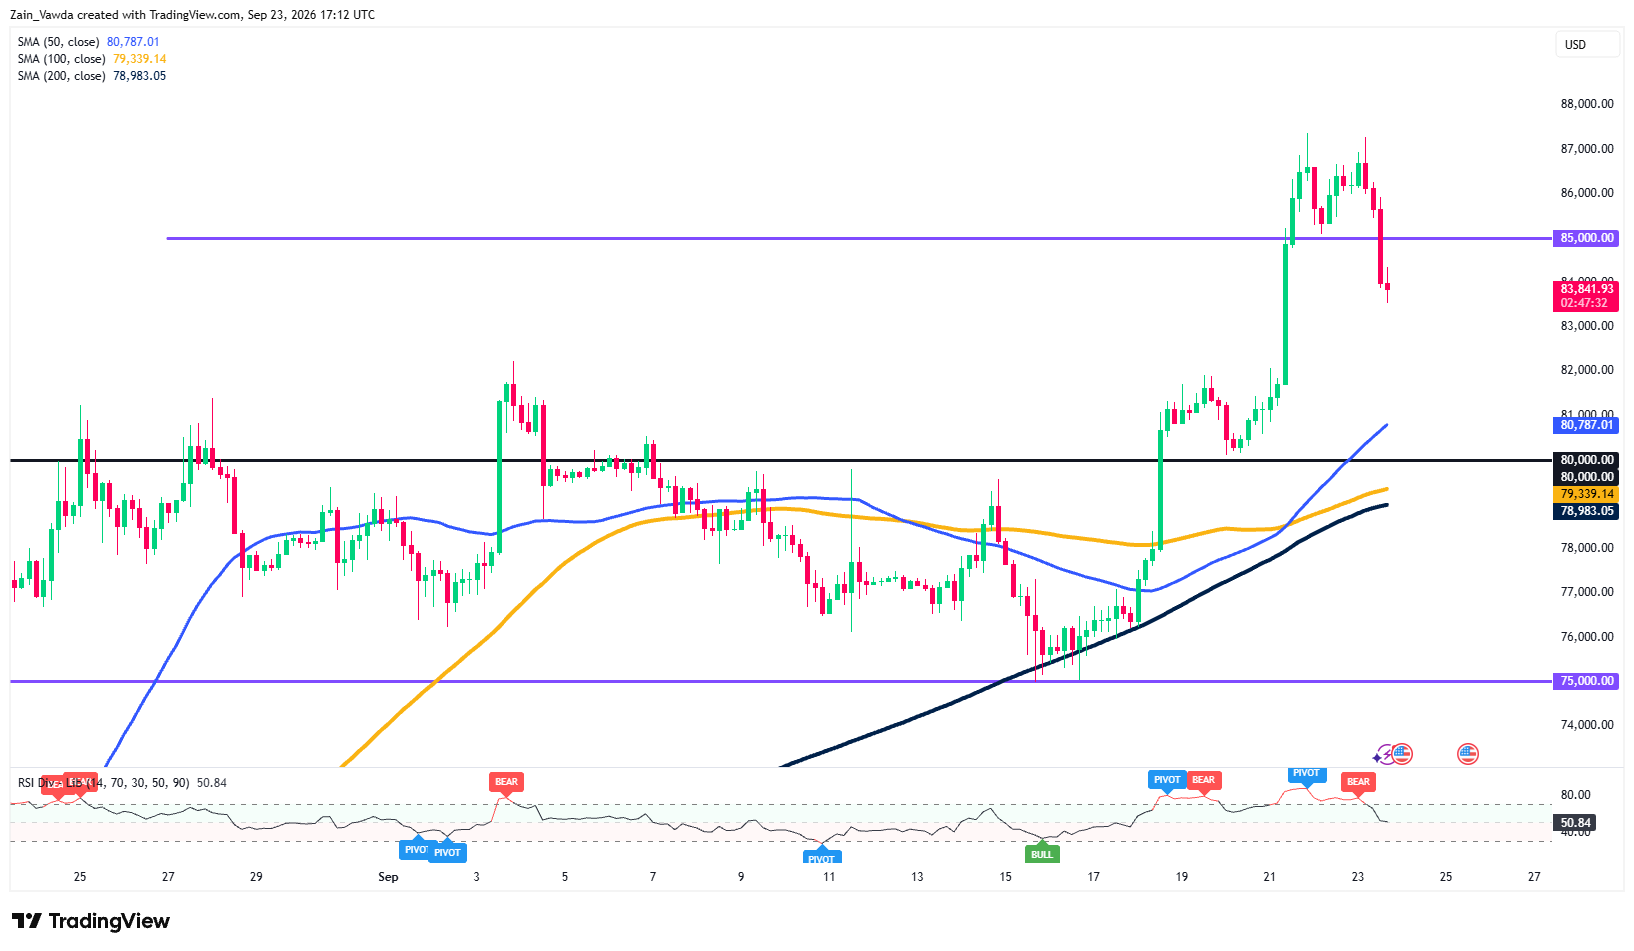
Bitcoin Four-Hour Chart, September 23, 2026
Source: TradingView
On the four-hour (H4) chart, the trend is still up. Price sits well above the 50, 100 and 200 moving averages, all clustered between about $79,000 and $80,800 and all pointing higher. RSI has cooled to around 51 after flagging bearish divergence at the highs.
That means momentum faded even as price tested the top.
The key message: losing $85,000 hurts, but the uptrend only breaks below $80,000.
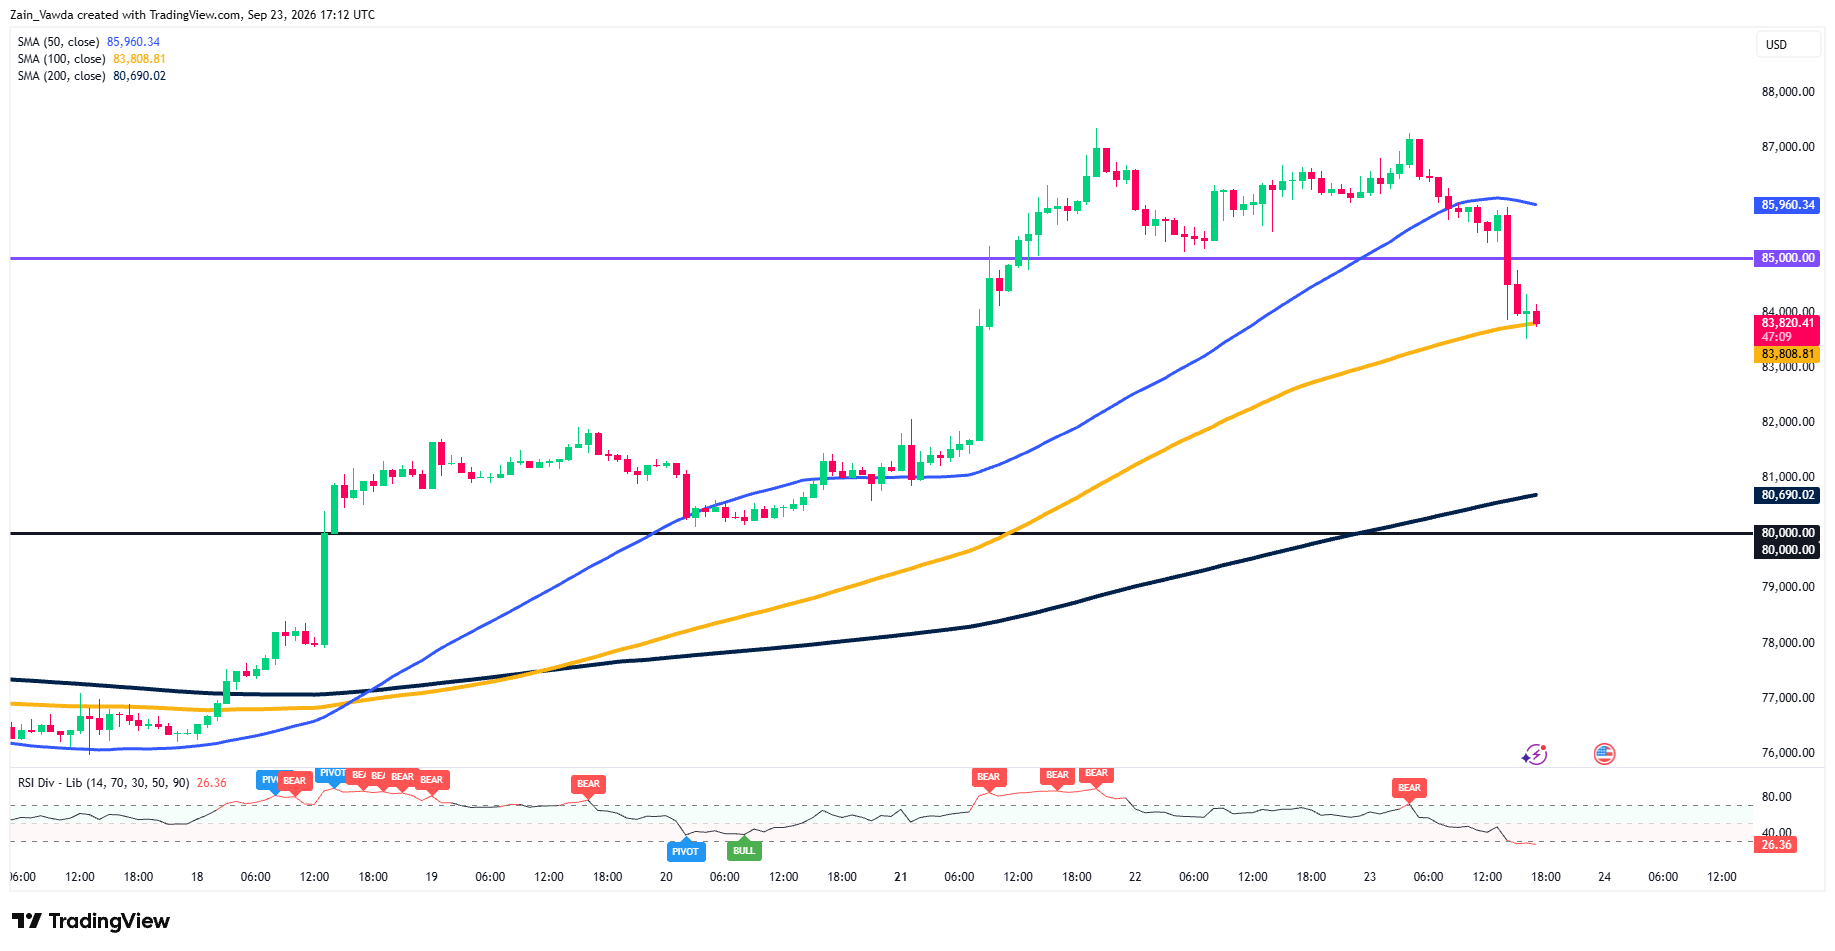
Bitcoin One-Hour Chart, September 23, 2026
Source: TradingView
The one-hour (H1) chart shows the short-term damage. Monday’s and Wednesday’s highs near $87,300 form a double top, and the break below $85,000 confirms it. The pattern points to about $83,000. Price is now testing the 100-hour moving average near $83,800, and RSI is deeply oversold near 26, so a bounce is possible. Former support at $85,000 should now act as resistance.
Outlook: Rest of the Week
Thursday brings U.S. jobless claims, a seven-year Treasury auction and the Trump–Xi meeting. A strong jobs number would add to hike bets and pressure Bitcoin.
Friday’s options expiry is the big one: expect choppy trade into it and possibly a sharper move after it.
Potential Scenario Matrix
| Scenario | Trigger | Bitcoin Path |
|---|---|---|
| Bull | Holds $83,000, ETF inflows continue, softer yields | Reclaims $85,000, then $86,000 and a retest of $87,300 |
| Base | No major surprise before expiry | Choppy range between $82,000 and $85,000 into Friday |
| Bear | Hot data, DXY breaks 101, ETF outflows | Break of $82,000 targets $80,000–$80,800 |
For Traders
If traders are buying the dip toward $82,000 while traders chase shorts, it points to the pullback being bought. If traders are trimming longs into Friday’s expiry, it suggests more room to fall.