
Spot gold (XAU/USD) was down about 0.8% in the European session, trading near $4,340 ahead of the U.S. session, snapping a two-day bounce after Friday’s failure at $4,400. But the bigger picture has not changed: price has broken out of the triangle pattern and a move higher still remains very much in play.
Heightened Geopolitical Tensions Weigh on Gold
As has been the case since the start of the U.S.-Iran war, any increase in hostilities has had an adverse impact on Gold prices. This is down to the oil-inflation-rate hike pipeline which continues to be a driving force for gold prices.
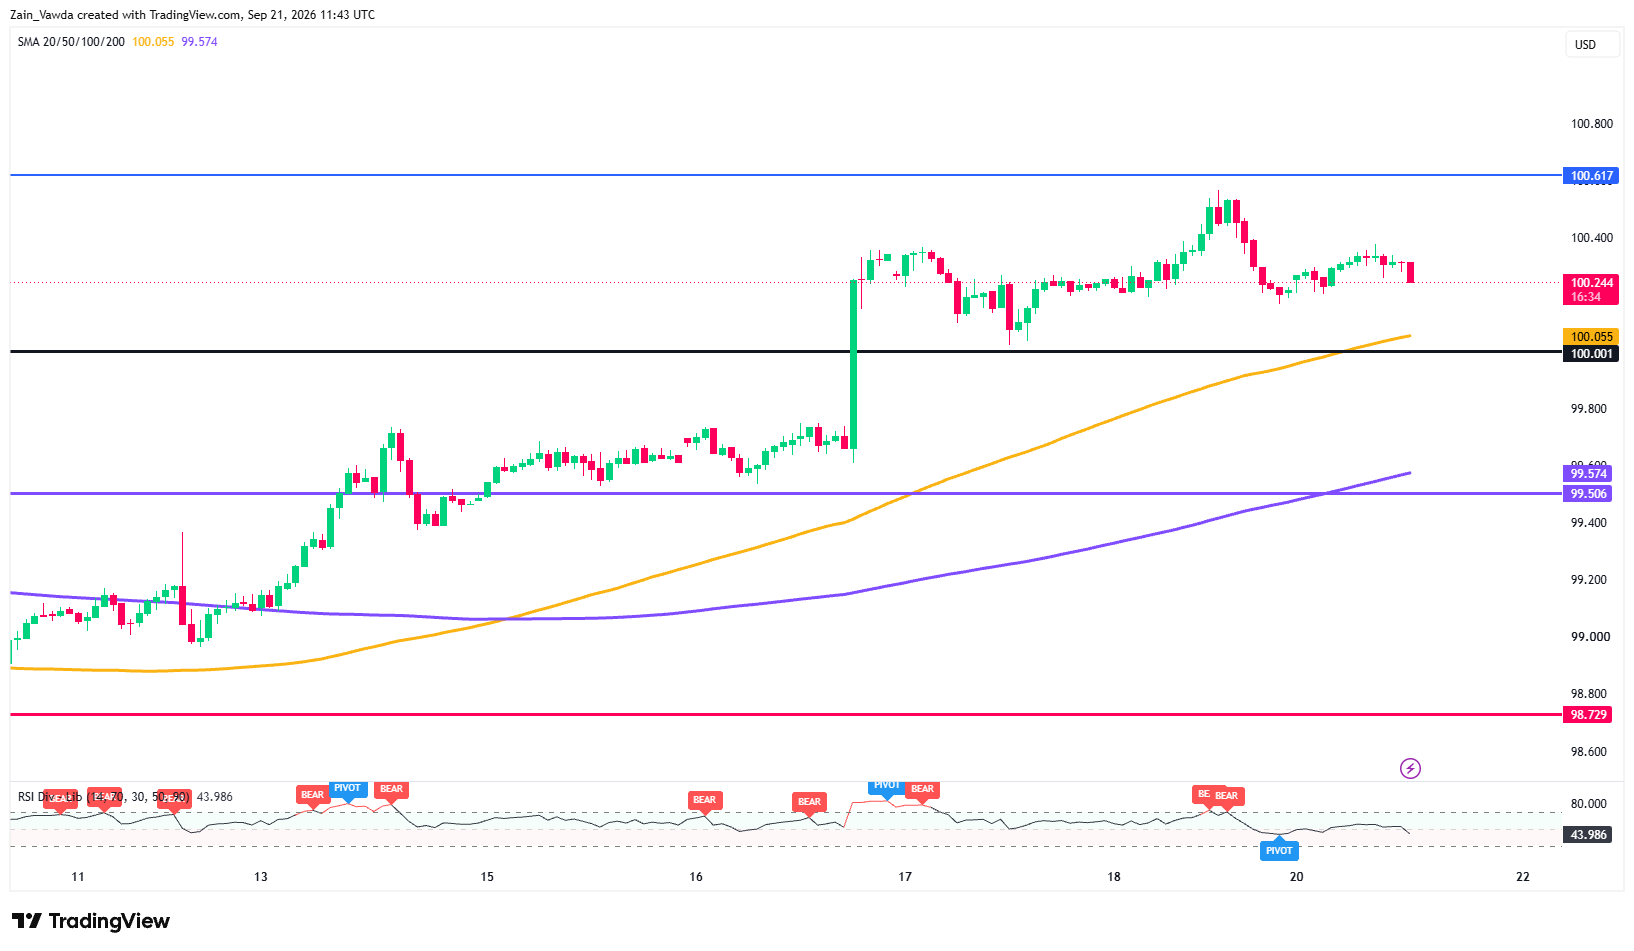
Gold is enjoying a bounce at the moment as the DXY appears to be losing its bid ahead of the U.S.open.
US Dollar Index One-Hour Chart, September 21, 2026
Source: Tradingview
The Federal Reserve delivered a rate hike last week. Earlier today we heard comments from policymaker Austan Goolsbee. Goolsbee stated that the Fed can no longer assume that inflationary supply shocks will quickly fade, arguing that persistent disruptions may require a monetary-policy response. This may add to rate hike expectations moving forward which could add another headwind for gold prices, even if its temporary.
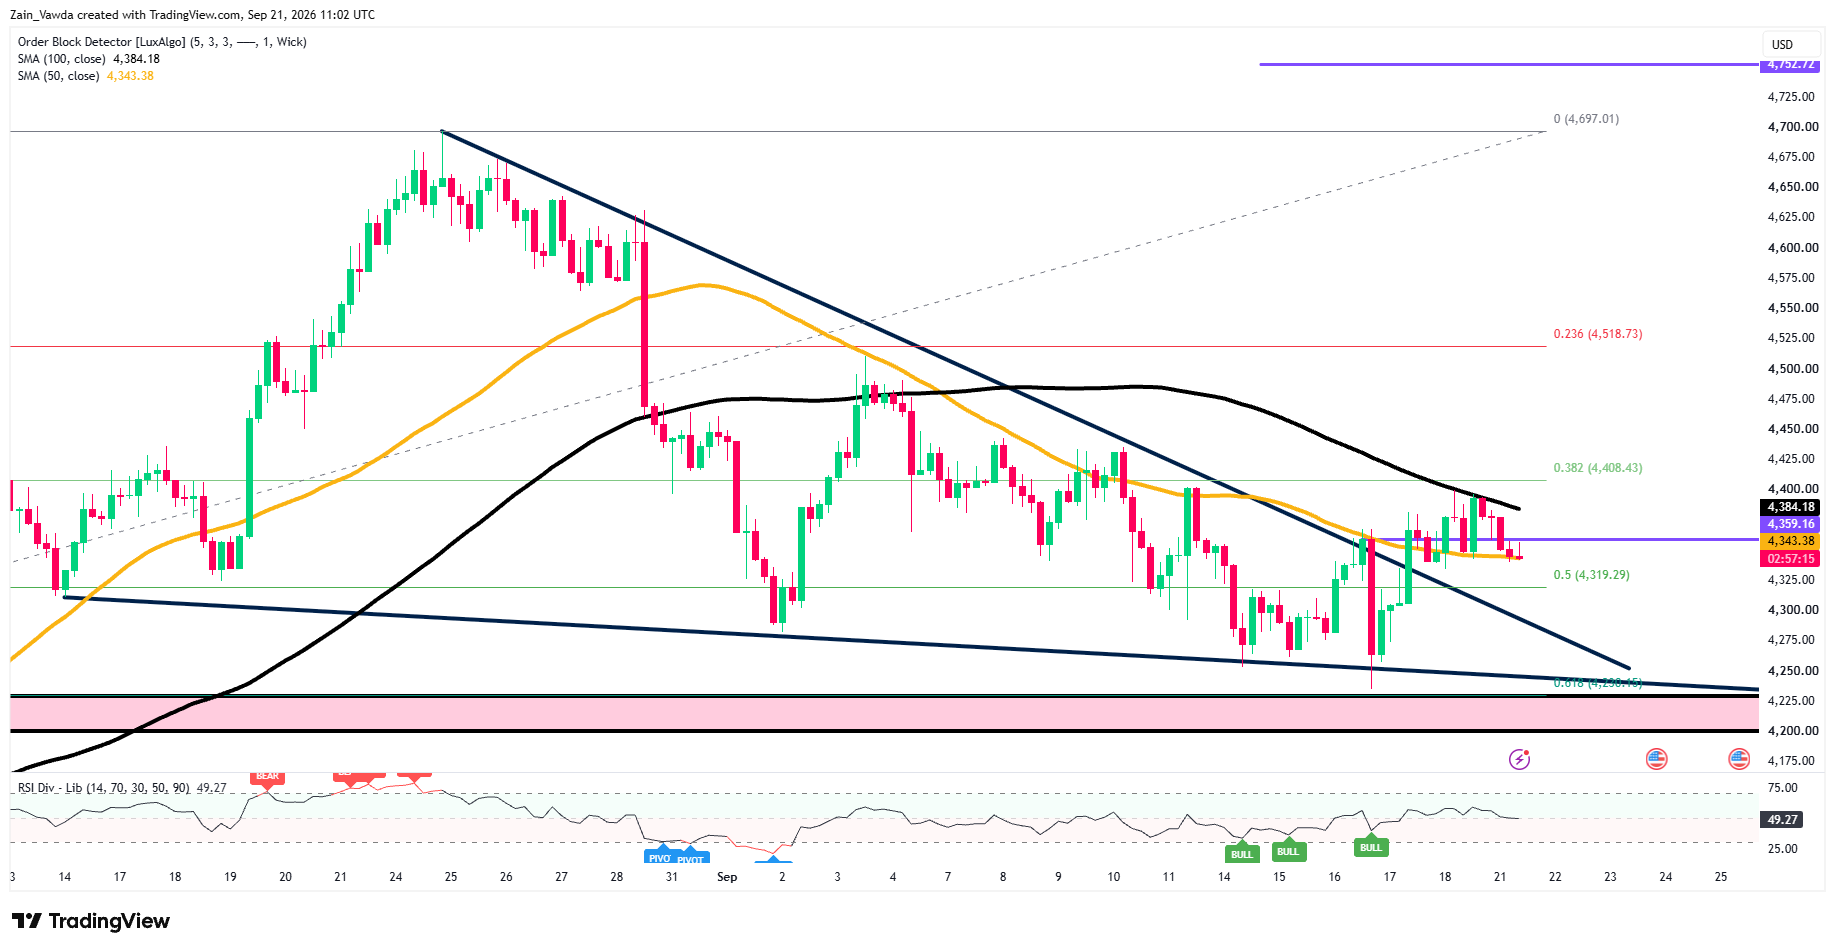
The Chart: Triangle Breakout Remains Valid
Gold Four-Hour Chart, September 21, 2026
Source: TradingView
Gold (XAUUSD) is consolidating within a broader four-hour (H4) corrective channel after rebounding off the $4,250 support region.
Price recently tested the H4 50 MA ($4,343.38), but buyers returned to push prices toward the H4 100 MA ($4,384.18). This level could cap any attempt at a break of $4,400/oz.
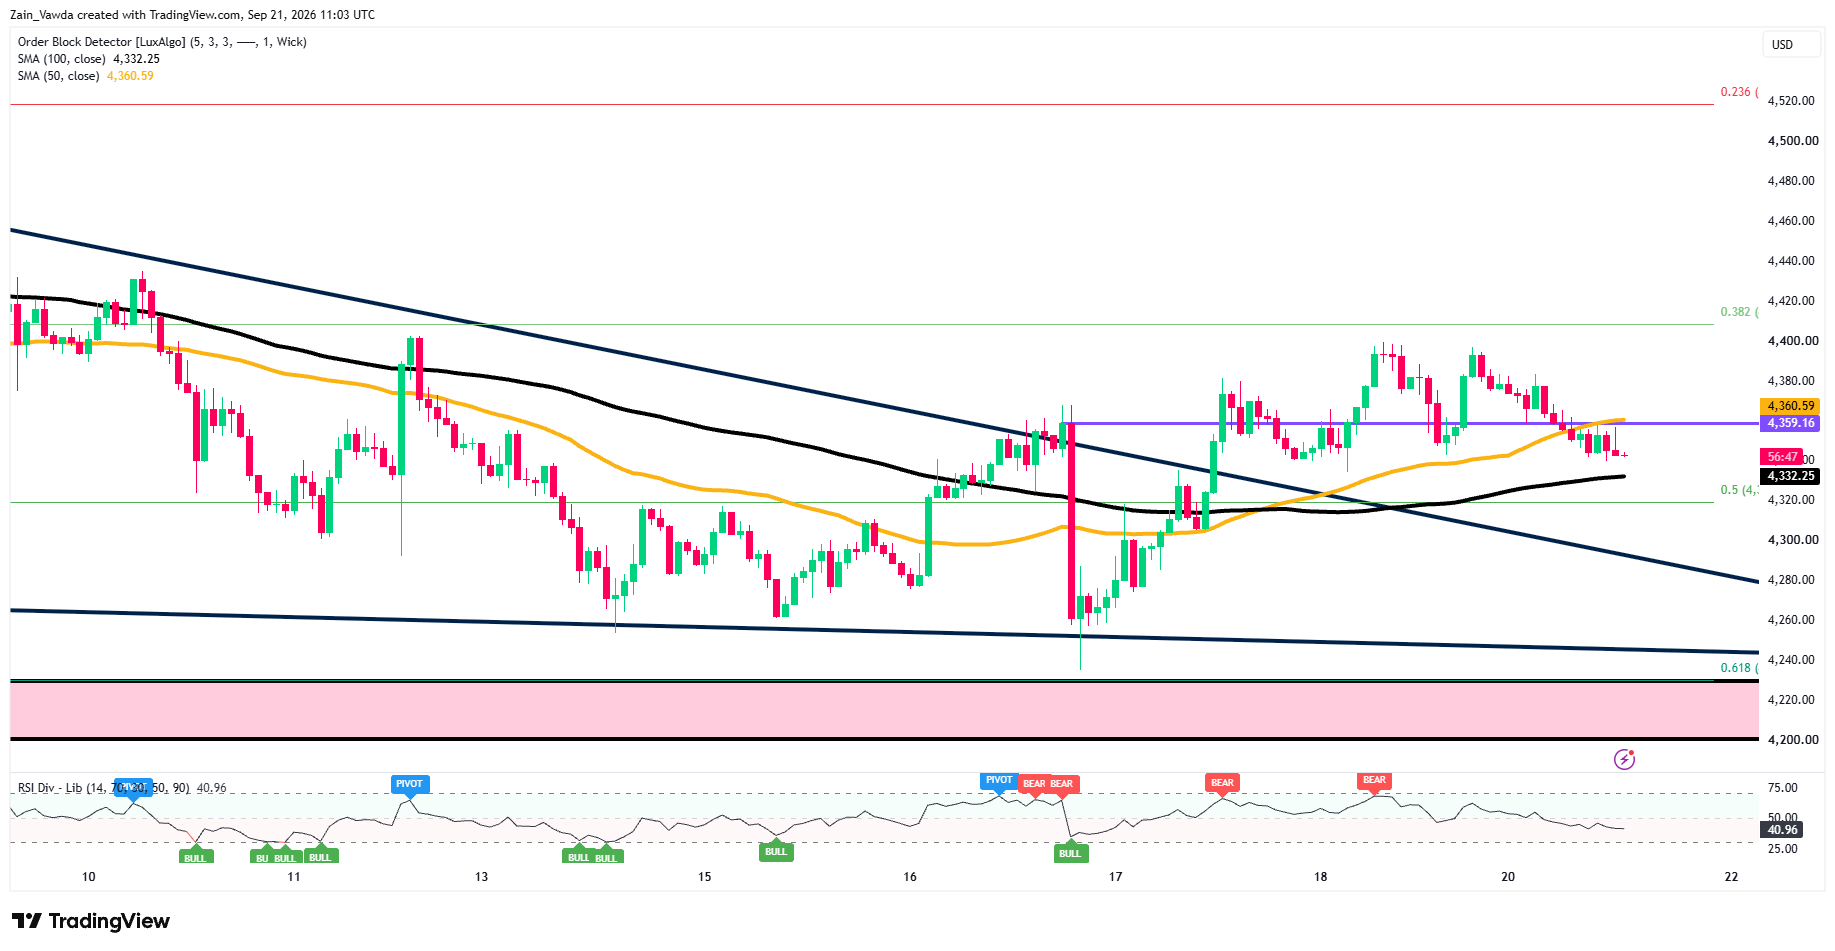
Gold One-Hour Chart, September 21, 2026
Source: TradingView
On the one-hour (H1) timeframe, momentum has cooled with RSI dropping near 40.
A sustained hold above the $4,343–$4,360 confluence zone keeps the bullish recovery intact, setting up potential retests of overhead resistance at $4,384 and $4,408.
A breakout above $4,408 would clear the trend-line, opening room toward the 0.236 Fib at $4,518.73. Conversely, failing to hold $4,343 could trigger further weakness toward the H1 100 MA ($4,332.25) and the 0.5 Fib at $4,319.29, with deeper losses exposing the primary demand zone between $4,200 and $4,238.
Outlook: Today and Tomorrow
Monday is a quiet data day, a speech from the Fed’s Austan Goolsbee, the Chicago Fed activity index and Treasury-bill auctions, with world leaders gathering at the UN. Nothing top-tier, so gold is likely to drift and consolidate below $4,400, moved mostly by headlines.
Tuesday looks similar (another Chicago Fed reading). The real tests come later in the week: flash business-activity PMIs midweek, the Trump–Xi meeting on Thursday, and the big one, Friday’s PCE inflation report, the Fed’s preferred gauge.
Keep one eye on Japan too: talk of currency intervention could jolt the dollar and, with it, gold.
Base case into those events: more coiling. Expect gold to chop between roughly $4,320 and $4,400 unless a headline forces an early break.
Trader Positioning Data
Gold positioning data from MarketFrameworks Positioning Edge Tool displays a strong bearish divergence, signaling a negative sentiment bias among top-performing accounts.
Profitable traders are currently 8% more short than unprofitable traders, with only 44% of profitable accounts holding long positions compared to 53% among unprofitable accounts.
This positioning gap indicates that successful market participants are actively fading recent upside momentum or accumulating short exposure.
Supported by a 10% increase in trading volume, the overall order flow heavily favors sellers, pointing toward potential downside pressure on gold.