Silver futures are back at a critical technical crossroads, with prices around $64.8 as buyers attempt to extend a rebound from the low-$63 area.
The recovery comes on the same day as the Federal Reserve's September policy decision, adding a major potential catalyst to an already important technical setup. Markets have been pricing a high probability of a 25-basis-point (bps) rate hike, but the reaction in silver could depend more on the Fed's guidance and Chair Kevin Warsh's comments than on the rate move itself.
For silver traders, the immediate question remains whether the contract can convert its rebound into a sustained break above $65-$65.50.
$65-$65.50 Is the Immediate Battleground
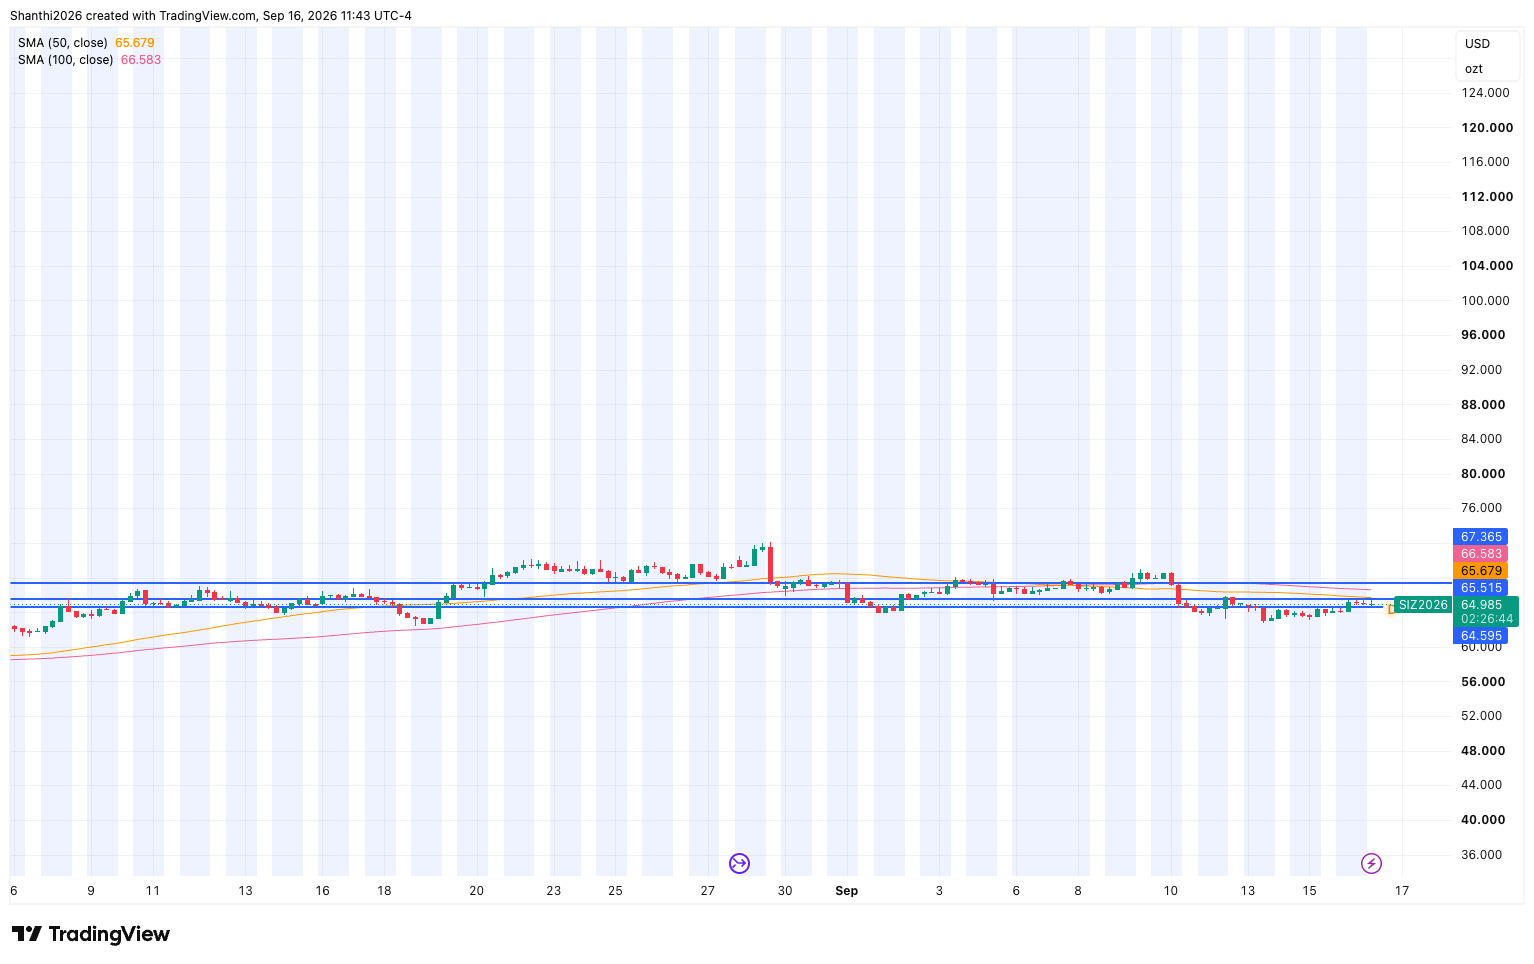
The $65 psychological level is the first hurdle for bulls, followed by the recent $65.40-$65.50 swing-high zone.
A move through $65 would be constructive, but a sustained break above $65.50 would be more significant because it would take silver above its most recent short-term resistance area.
If buyers can establish prices above $65.50, attention could potentially shift toward $66, followed by $66.25 and potentially the $67 area. The key distinction is between an intraday spike and a confirmed breakout. Silver needs to hold the reclaimed levels, rather than simply trade above them briefly.
FOMC Decision Could Test the Breakout
The Fed decision introduces a potentially large volatility event directly into this technical setup.
A 25bps hike is widely expected, meaning the initial silver reaction could depend heavily on the statement, economic projections and Warsh's press conference.
For silver, the transmission mechanism is straightforward. A more hawkish policy signal could push Treasury yields and the dollar higher, potentially creating pressure on precious metals. A less-hawkish message, particularly if markets interpret the hike as a one-off rather than the beginning of a sustained tightening cycle, could have the opposite effect.
That makes $65-$65.50 particularly important during the Fed reaction. If silver breaks above the zone and holds despite a hawkish interpretation, that would represent notable price strength. Conversely, a rejection from resistance accompanied by higher yields and a stronger dollar could send the contract back toward its support levels.
Retail positioning in silver futures (ICE-traded SI contract) shows traders are evenly split. MarketFramework's Top Traded Contracts, however, reveals divergence between winning and losing trades. 88% of winning trades are long, while 73% of losing trades are short. In other words, the traders currently making money are overwhelmingly positioned for higher silver prices, while the losing cohort is heavily short.
If silver clears $65.50 and holds, the large concentration of profitable longs could indicate that traders positioned correctly for the rebound are being rewarded, while the large short exposure among losing traders creates potential for additional short covering.
Conversely, if silver fails at $65-$65.50 and drops back below $64, the current positioning could quickly become less supportive. The 73% short exposure among losing trades suggests that many traders are already on the wrong side of the recent rebound, but a failed breakout could give those positions a chance to recover.
Silver Holds Mid-range But Near-term Structure Turns Cautious
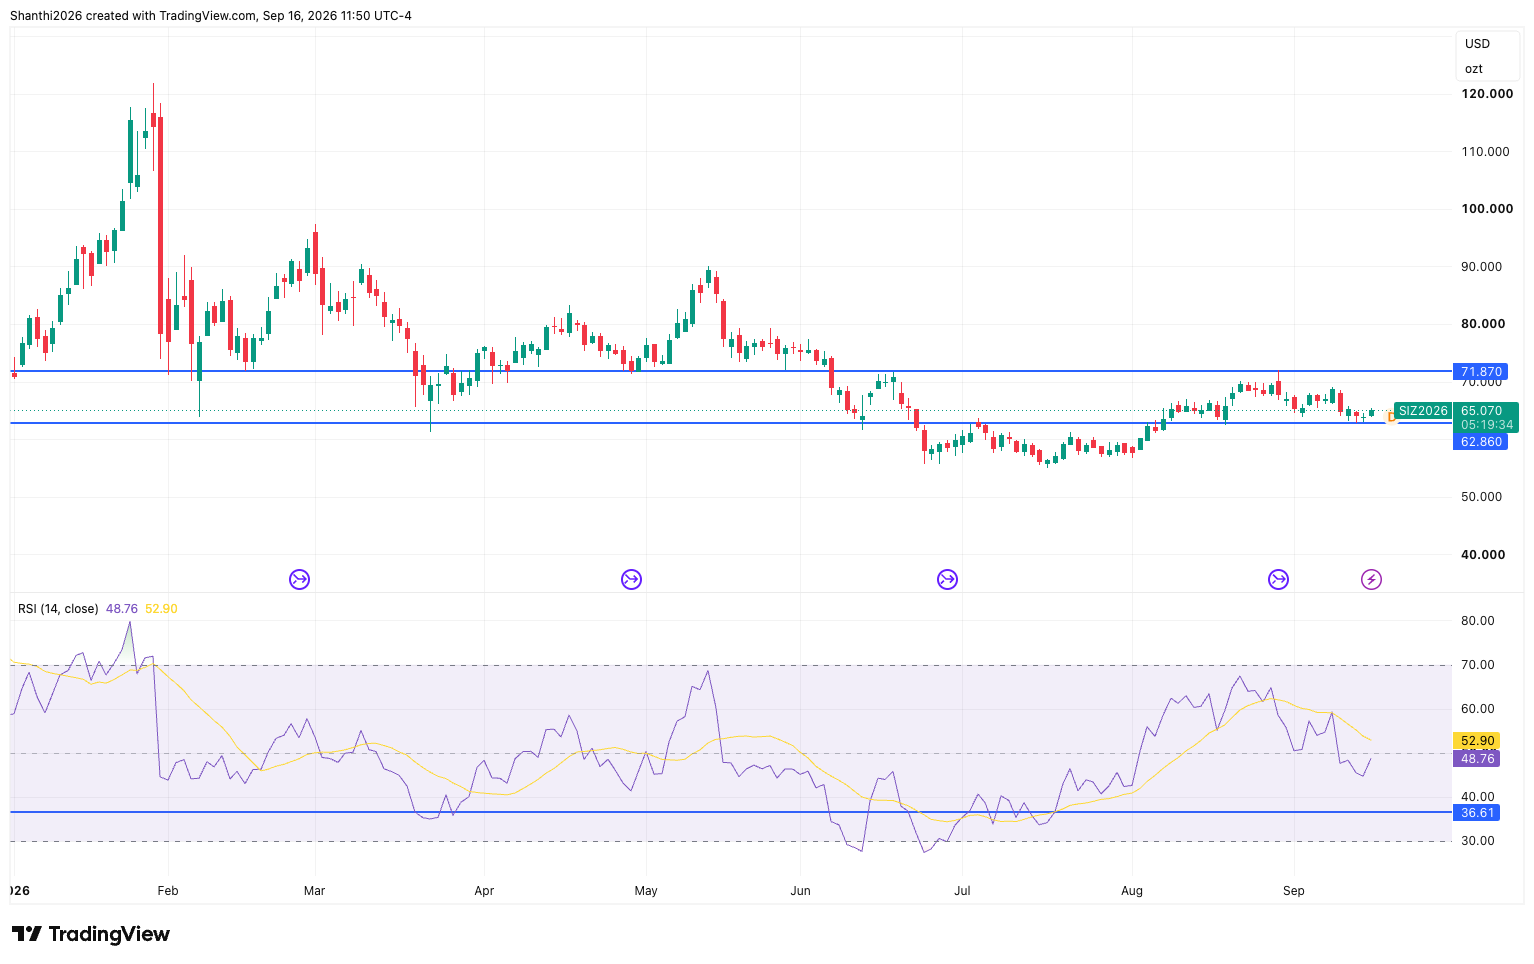
The white metal is trading squarely inside the range that has been defined since mid-year, bounded by resistance at $71.84 above and support at $62.810 below. The daily chart shows a market that has spent all of 2026 making lower highs, from the $120 blow-off spike in January, down through $88-$90 in May, before breaking down in June to base around $55-$58. Price has recovered off the lows into the current range, but the attempt to push through $71.8 in late-August failed.
Source: TradingView
The near-term picture has deteriorated further. H4 chart shows price below the 50-period simple moving average (SMA) and 100-period SMA, with the 50 having crossed beneath the 100, a bearish signal, and both averages flattening out. Reclaiming the moving averages would neutralize the bearish tilt and set up another run at $71.8. However, a daily close below $62.8 would be more consequential as it is the exact level that triggered the fast June drop toward $55.
Source: TradingView
RSI: Is Momentum Actually Turning?
The 14-day RSI provides another way to assess whether the rebound has enough momentum behind it.
After silver's sharp decline, RSI moved toward oversold territory in late June. The subsequent recovery suggests that downside momentum has eased, but traders should distinguish between an oversold bounce and a sustained momentum reversal.
A move back above the 50 RSI midpoint would provide stronger evidence that momentum is shifting toward buyers. A push toward 60 or higher would provide additional confirmation.
If silver reaches $65 while RSI remains unable to regain 50, the price rally would carry a weaker momentum signal and could be more vulnerable to rejection.
The Real Test Comes After the Initial Fed Move
Silver's first reaction to the FOMC announcement could be volatile, but the more useful signal may come afterward.
The contract is already sitting near a technically important resistance zone. A sustained move above $65.50 would improve the short-term structure, while failure to hold $65 would leave the rebound vulnerable.
That makes the Fed decision a catalyst rather than the entire trade thesis. The price action following the announcement, particularly whether silver can hold $65-$65.50 while yields and the dollar adjust, could provide a clearer signal of whether the recent bounce is developing into a breakout or fading back into the correction.