
The S&P 500 snapped a four-session losing streak Friday despite a consumer price inflation (CPI) report that showed underlying inflation remains firm enough to complicate the Federal Reserve’s policy outlook.
Headline CPI rose 0.4% in August, matching expectations, while core CPI increased 0.3% month over month versus the 0.2% consensus. The annual core rate eased to 2.4% from a revised 2.5% in July.
The market’s ability to recover despite the firmer core reading suggests investors are not yet willing to abandon the equity rally over renewed inflation and rate concerns. But next week’s Federal Reserve rate decision could provide a much bigger test.
Stocks Shrug Off Hotter Core CPI
The 0.3% monthly increase in core CPI was the main blemish in an otherwise relatively contained inflation report. The reading indicates that underlying price pressures remain above the pace policymakers would ideally like to see.
Chris Zaccarelli, Chief Investment Officer at Northlight Asset Management, said investors hoping for cooling or moderation in core inflation would be disappointed.
He argued that Fed Chair Warsh is facing a difficult policy environment, with inflation showing limited signs of cooling, Treasury yields rising and political pressure for lower interest rates.
The challenge for equities is that higher rates can pressure valuations even when corporate earnings remain strong. For now, however, investors appear willing to look beyond that risk.
Next Week's Fed Decision Is the Bigger Test
The CPI data leave the Fed facing a difficult choice ahead of its next meeting. A 0.3% monthly core increase gives hawkish policymakers ammunition to argue against pausing policy, even as other parts of the economic picture point toward less restrictive policy.
Jeffrey Roach, Chief Economist at LPL Financial, said the monthly core inflation pace is hotter than normal and that the economy would need more consistent 0.1%-0.2% monthly increases to make a stronger case for price stability.
Roach also noted that markets expect a 25-basis-point rate hike next week, although the economic impact could be muted because an increasing share of activity appears less sensitive to interest rates.
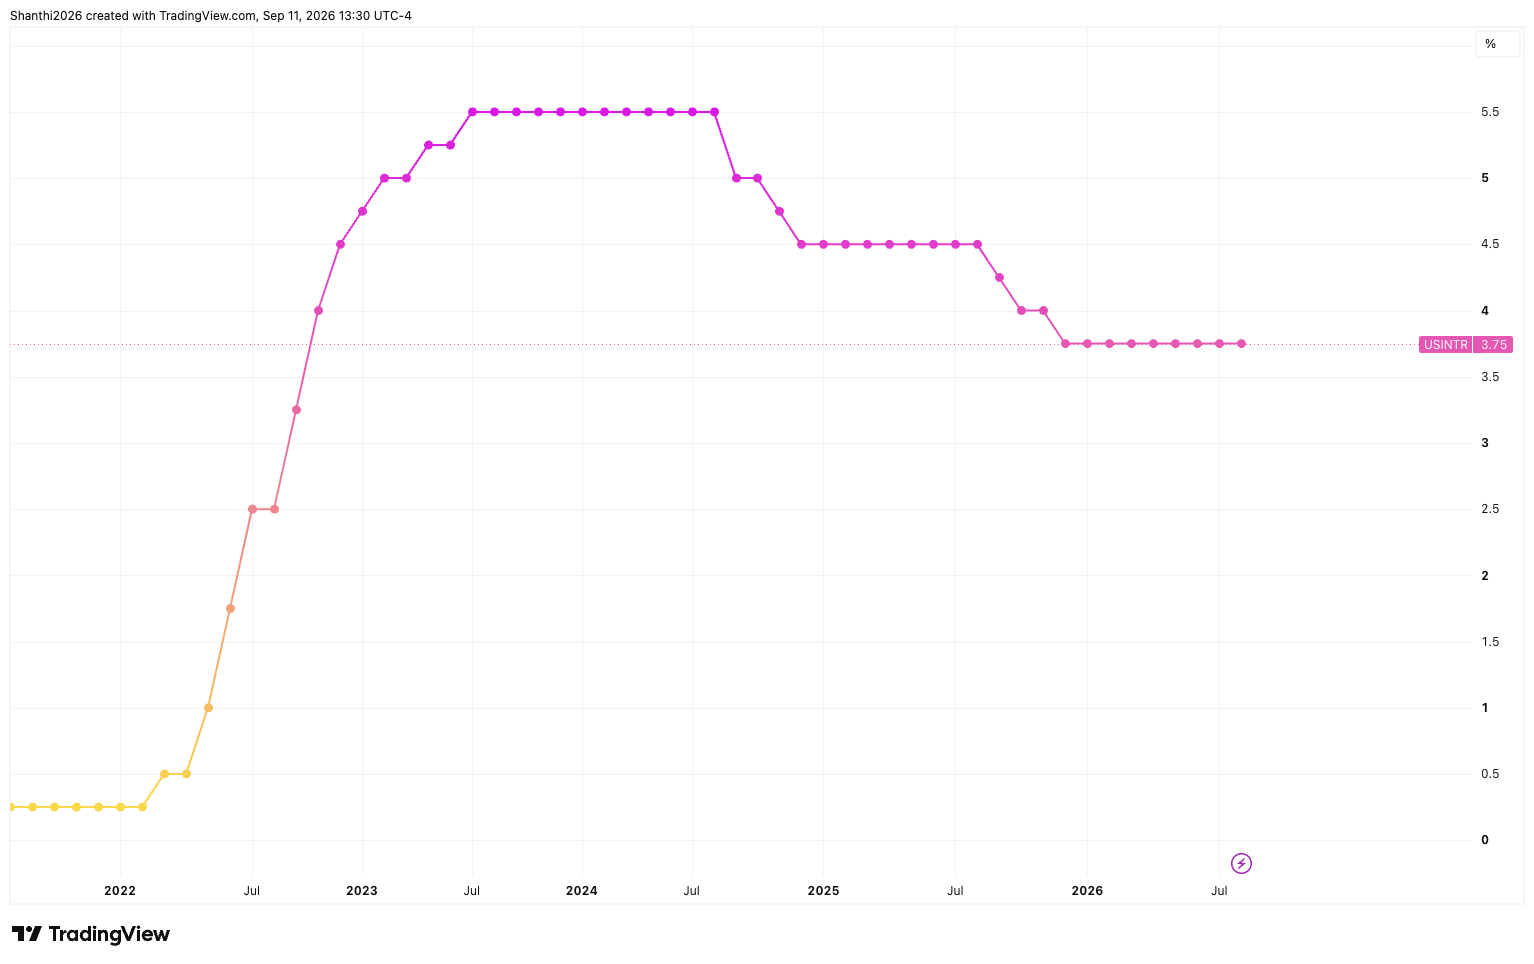
If the Fed announces a quarter-point hike next week, it would be the central bank’s first hike since July 2023. So, how does the market receive a first hike in a tightening cycle?
Fed Funds Target Rate Trajectory
Source: TradingView
LPL Research’s Jeff Buchbinder says history suggests an initial Fed rate hike can trigger short-term turbulence without necessarily ending a bull market. Across six tightening cycles since 1994, the S&P 500 generally struggled during the first few months after the initial hike before regaining its footing, with the index averaging a 6.7% gain 12 months later and a 10.7% median gain.
The 2022 tightening cycle was a notable exception, as surging inflation, rapidly rising long-term yields and growing recession fears kept stocks under pressure for more than a year. Buchbinder sees the current backdrop as more comparable to the late 1990s, when strong economic growth and enthusiasm around transformative technology helped equities absorb higher rates. With recession risks currently contained, he argues that modest additional rate hikes could create volatility but may not derail the broader equity rally.
Consumer Spending Could Keep Inflation Sticky
The composition of the inflation report adds another layer to the Fed debate. Used vehicles, airfares, hotels and communication prices all contributed to the increase in core inflation.
Roach pointed to restaurant spending as another sign that demand remains resilient. Restaurant spending was up 3.4% from a year earlier, suggesting consumers continue to spend in areas that may not respond quickly to incremental changes in borrowing costs.
That could make the Fed's job harder. If affluent consumers, baby boomers and businesses continue spending despite tighter policy, inflation could remain sticky even as interest rates rise.
AI Boom vs. Higher Rates
For the S&P 500, the ability to withstand higher yields could ultimately depend on whether earnings growth remains strong enough to offset valuation pressure.
Roach expects artificial intelligence (AI) investment and resilient consumer spending to support nominal economic growth above 6% over the next several quarters, providing a fundamental cushion for corporate revenues.
That helps explain why stocks were able to recover Friday despite the hotter core CPI reading. Investors continue to have a powerful counterweight to the rate narrative: strong earnings expectations and the ongoing AI investment cycle.
But that cushion will be tested if yields continue climbing.
Can the S&P 500 Keep Rallying?
Friday's rebound does not necessarily mean inflation concerns have disappeared. Instead, it shows that investors remain willing to absorb higher-rate risks as long as earnings, economic growth and AI optimism remain intact.
The next Fed decision could therefore be less about the immediate rate move and more about the message accompanying it.
The bullish case is not necessarily “no hike.” A 25-basis-point hike that restores the Fed’s inflation-fighting credibility but is accompanied by a signal that policymakers may stop there could actually be absorbed well by stocks. That fits the historical pattern cited by LPL Research, where initial hikes often caused near-term weakness but did not necessarily end broader bull markets.
The bigger threat to the S&P 500 is a hike plus a hawkish path. If investors begin pricing multiple additional increases while oil remains elevated, Treasury yields could rise further and increase the discount rate applied to future corporate earnings. That would put particular pressure on high-valuation growth and AI stocks.
Scenario Analysis for Fed Decision
| Scenario | Fed Decision | Policy statement | September Dot Plot/Warsh's press briefing | S&P 500 Reaction |
|---|---|---|---|---|
| Bullish | 25bps hike | Acknowledges sticky inflation but emphasizes data dependence and balanced risks | Dot plot shows one hike and done | Initial volatility, then potential rally as markets interpret the hike as “one and done” |
| Mildly Bullish | 25bps hike | Says further moves will depend on incoming data; no strong hawkish guidance | Median dot points to one additional hike but easing in 2027 | S&P 500 likely holds up; growth/AI stocks could recover if yields stabilize |
| Neutral | 25bps hike | Keeps options open and stresses persistent inflation risks | Dots split, with no clear path beyond September | Choppy trading as stocks weigh resilient earnings against higher rates |
| Bearish | 25bps hike | Explicitly warns that additional tightening may be needed | Median dot signals multiple additional hikes in 2027 | Higher Treasury yields pressure valuations; S&P 500 risks extending its pullback |
| Very Bearish | 25bps hike | Hawkish language highlights upside inflation risks and limited progress toward price stability Higher rate path plus higher inflation projections | Hawkish hike+ upward inflation forecasts + higher terminal rate projection | Sharp risk-off move as markets price a renewed tightening cycle |
For traders, the key question is no longer simply whether inflation is cooling. It is whether strong growth and earnings can keep the stock market rising even as the Fed becomes less willing, or less able, to provide policy support.
Bulls Defend Key Support as Momentum Cools
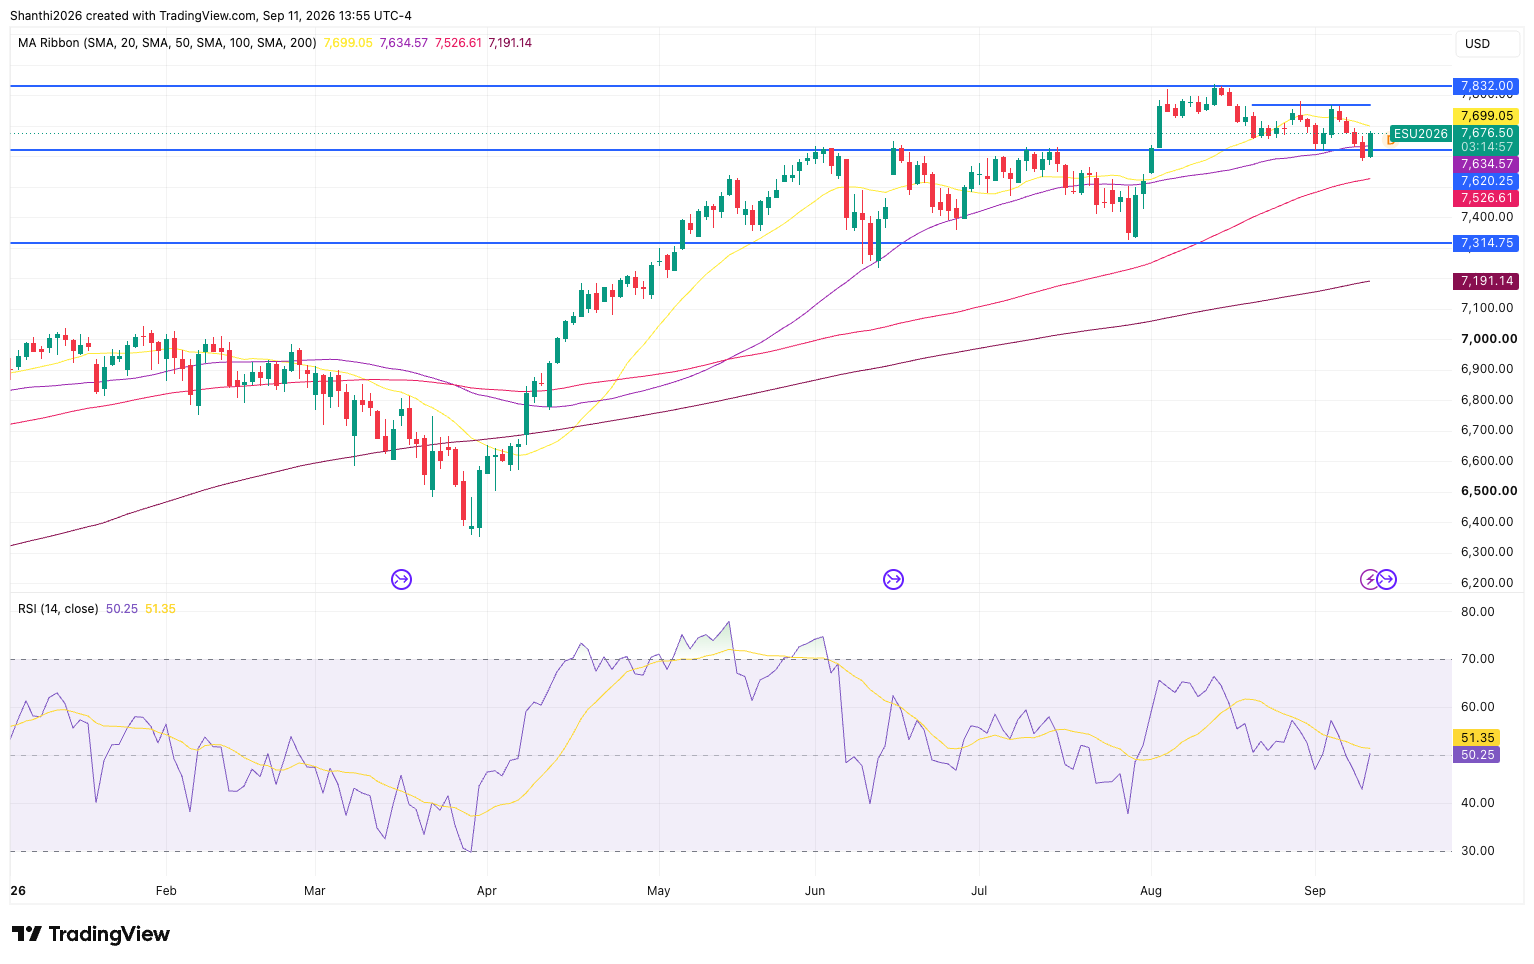
ES futures are testing a key technical zone after pulling back from the recent highs near 7,832. Price has slipped below the 20-day SMA at 7,699 and is currently probing support around the 50-day SMA at 7,635, a level that coincides with the breakout area from early August. While the short-term structure has weakened, the broader uptrend remains intact as long as ES holds above the rising 100-day SMA near 7,527. A decisive break below the 50-day average would increase the risk of a deeper retracement toward 7,527 and potentially the major support area around 7,315.
Source: TradingView
Momentum indicators suggest the market is at a crossroads rather than in a strong trend. The RSI has eased to 50.3, hovering near the neutral 50 level and reflecting a loss of upside momentum following the August rally. The indicator remains well above oversold territory, implying there is room for additional downside if sellers retain control. For bulls, reclaiming the 7,700–7,750 region would signal renewed buying interest and bring the 7,832 record high back into focus. Until then, the near-term bias favors consolidation with support levels facing increasing pressure.
ES futures may be higher on the session, but trader positioning remains a warning sign. MarketFramework’s Positioning Edge tool shows that profitable traders are just 33.3% long compared with 58.3% long among unprofitable traders, creating an extreme bearish divergence that suggests more successful participants are fading the rally while losing traders continue to chase upside.
Historically, when profitable traders hold a significantly lower long exposure than the broader crowd, it can signal skepticism toward the sustainability of a move and increase the risk of pullbacks or failed breakouts despite short-term price strength.


