U.S. stocks started the week on the back foot. The Dow fell 347.11 points, or 0.67%, to 51,481.51, the S&P 500 lost 0.77% to 7,683.69, and the Nasdaq Composite slipped 0.92% to 26,820.38.
At the lows, the Dow was down more than 400 points and the S&P 500 about 1%. With Monday's drop, the S&P 500 has given back almost all of its September gains.
Yields Set the Tone Again
The main story was the bond market. The 10-year Treasury yield climbed back above 5.2% and the 30-year topped 5.5%, building on last week's sharp moves. Last week alone, the 10-year hit its highest level since 2007, the 30-year reached a 2004 high and the 2-year jumped about 17 basis points.
Higher yields matter for stocks because they make safe government bonds more attractive, and they raise borrowing costs for companies and consumers. Justin Bergner of Gabelli Funds told CNBC that yields have “come back up meaningfully today,” causing an “understandable weakness in the tape.” Traders also added to bets on an October Fed rate hike, which lifted the dollar and pushed gold lower.
The market got some relief around midday. CNN and Axios reported that Trump is open to lifting Iran sanctions and releasing frozen funds in exchange for real progress on a nuclear deal. That pulled crude well off its highs and helped stocks recover part of their losses. But with Iran still standing by a proposal Trump has rejected, Brent held near $105.
Stocks in Focus
Boeing was the biggest drag on the Dow, closing nearly 7% lower after the FAA said it will not certify the 737 Max 10 until it assesses a new software glitch. Meta fell 4.8%, giving back part of last week's near-13% rally, while AMD and Micron lost 3.6% and 2.6%. Amazon and Microsoft each slipped about 1%.
Nvidia went the other way, rising 1.7% after adding a record $150 billion to its share buyback, taking the total program to $235 billion. A buyback means the company uses its own cash to buy back its shares, which can support the stock price.
Nasdaq 100 Futures (NQ) H1 Technical Outlook
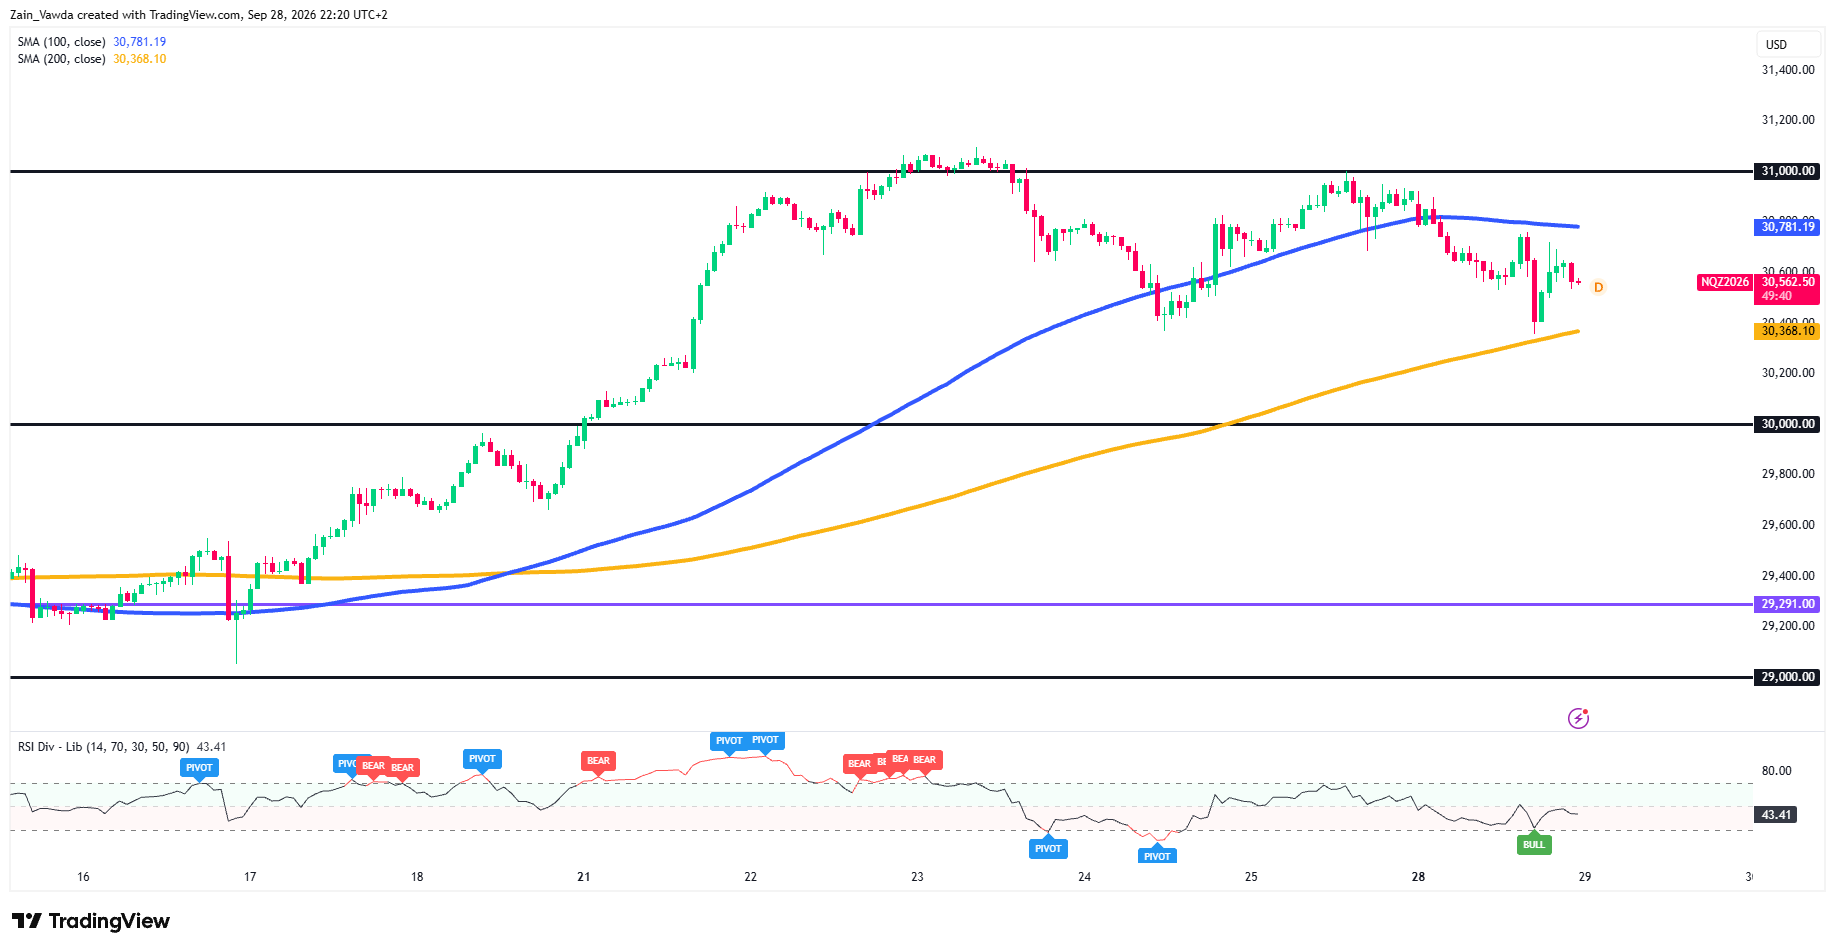
Nasdaq 100 (NQ) One-Hour Chart, September 28, 2026
Source: TradingView
NQ failed twice at 31,000, once on September 23 and again on September 25. Two failed tests at the same level form a double top, a pattern that often signals a rally is running out of steam.
Price broke below the 100-period moving average (30,781) early Monday and dropped to about 30,350 before the Iran headlines sparked a bounce.
That low landed right on the 200-period average (30,368) and last week's 30,400 low. This area is the neckline, the line that confirms the double top if it breaks.
RSI at 43 flashed a bullish divergence at the low, so buyers are defending it for now. But the bounce stalled near 30,700, and NQ is trading at 30,562.50 after the cash close.
Potential Scenario Matrix Into Wednesday's PCE Inflation Data
| Scenario | What Needs to Happen | Targets | What Invalidates It |
|---|---|---|---|
| Bull | Yields ease and Iran talks progress; NQ reclaims the 100-period average at 30,781 | 31,000 | A drop back under 30,560 |
| Base | Yields hold near 5.2% as traders wait for PCE | Range between 30,400 and 30,781 | An hourly close outside the range |
| Bear | Hot PCE or new yield highs; NQ breaks below 30,350 | 30,000, then 29,800 | A reclaim of 30,400 |
This morning's Positioning Edge read showed profitable NQ traders only 31.5% long against 64% for unprofitable traders.
Monday's drop rewarded the profitable group. The difference going forward is patience: profitable traders tend to wait for the 30,350 to 30,400 zone to either break cleanly or hold on a closing basis. Unprofitable traders are more likely to buy the first bounce straight into the 100-period average.