
S&P 500 futures (ES) are down about 0.6% ahead of the U.S. open, trading near 7,730.
As our US premarket report this morning explained, the pressure is coming from the bond market. The 10-year Treasury yield has climbed to around 5.13%, its highest since May 2007, after Wednesday’s strong PMI data showed prices rising fast and a weak Treasury auction added to the selling.
Higher yields hurt stocks in two ways. They make safe bonds more attractive, and they reduce what future company profits are worth today, which hits pricey tech names hardest. Oil is also back above $93, keeping inflation worries and Fed hike bets alive.
Traders also have the Trump–Xi summit to digest. The U.S.-China trade truce has been extended by two months to January 10, but that did little to lift the mood in Asia.
Today’s data includes weekly jobless claims at 8:30 a.m. ET and new home sales at 10:00 a.m. ET.
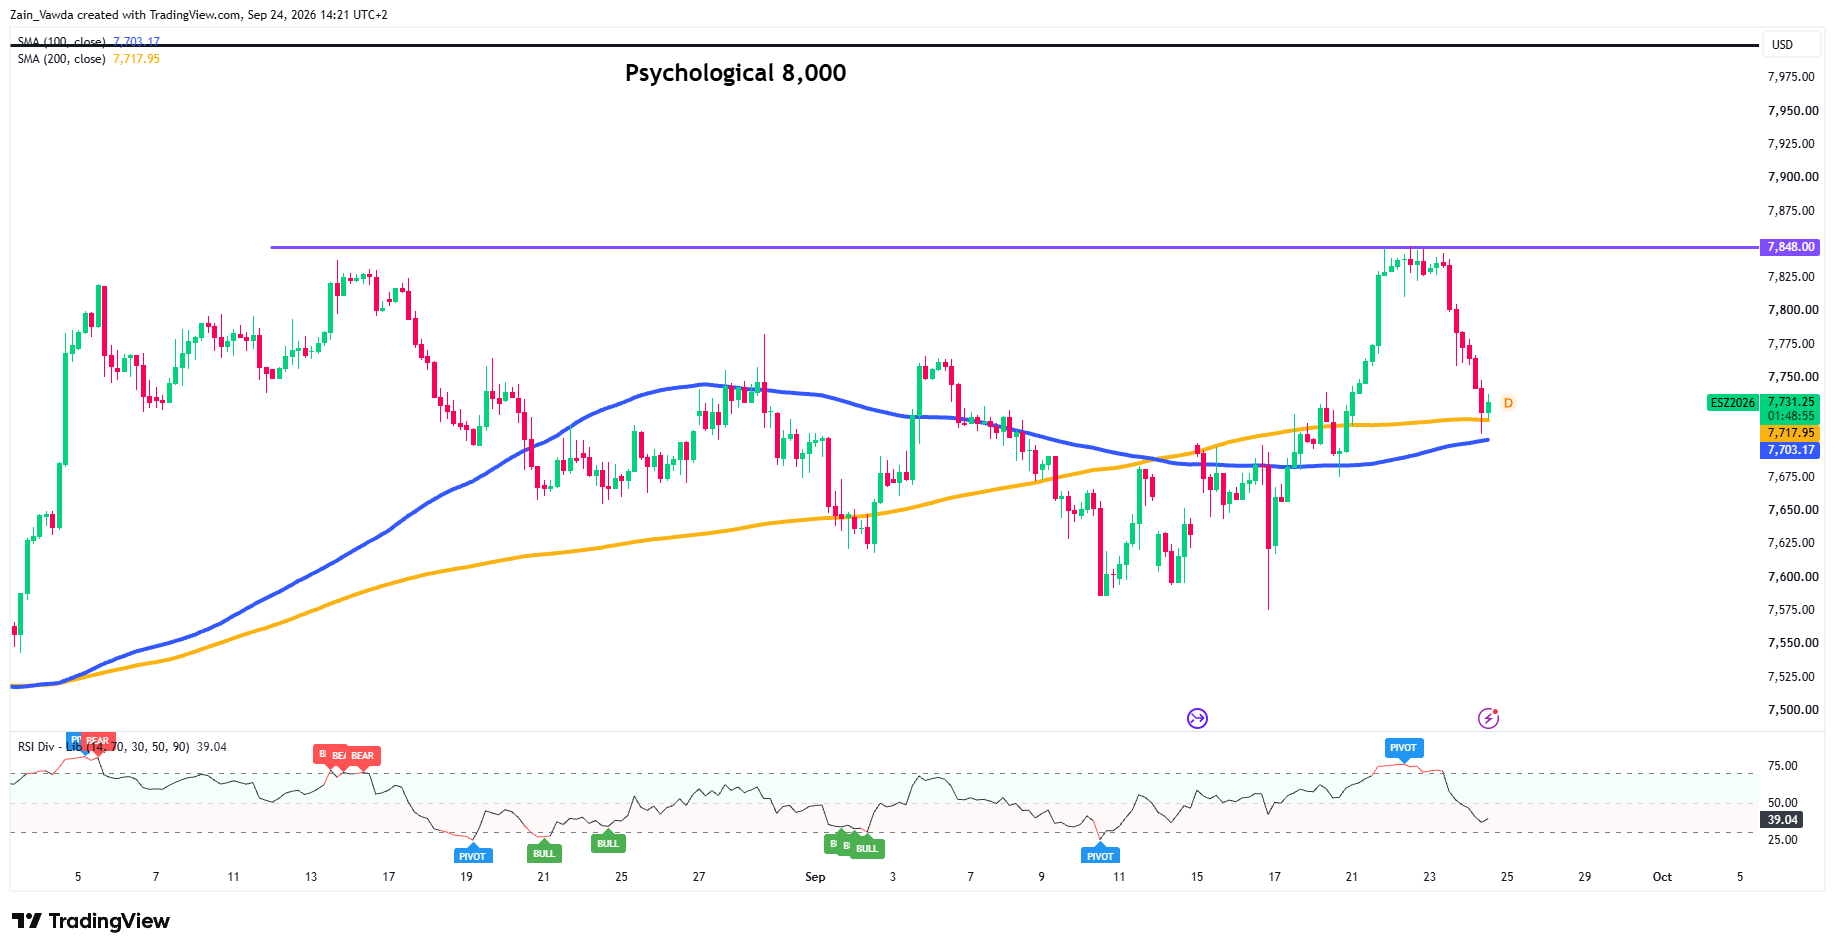
Four-Hour Chart: Rejected at the Range Top
S&P 500 Four-Hour Chart, September 24, 2026
Source: TradingView
The big picture is a range. ES has been stuck below 7,848 since mid-August, and this week’s push failed there again.
Two days of selling have now brought price back to a key support cluster: the 200-period moving average at 7,718 and the 100-period at 7,703. This 7,700–7,720 zone also lines up with the 7,700 cash-index pivot.
RSI is near 39, weak but not yet oversold. A clean break of 7,700 would put the September lows around 7,575–7,600 back in play.
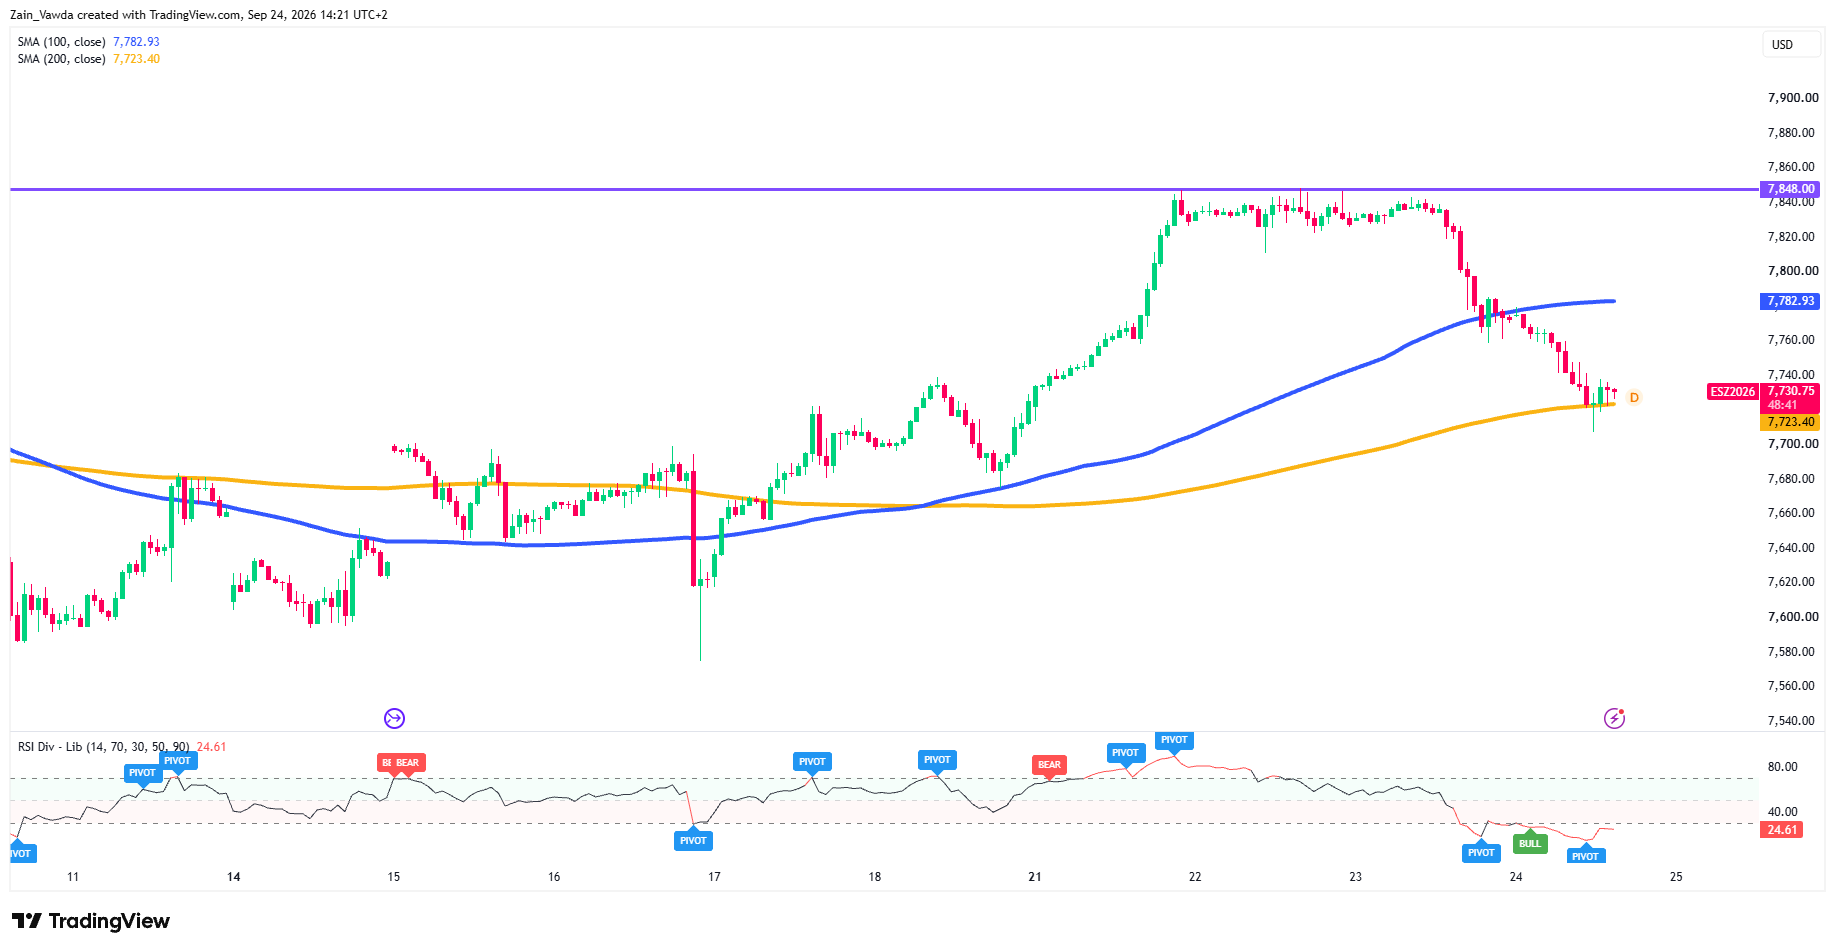
One-Hour Chart: Oversold at the 200-SMA
S&P 500 One-Hour Chart, September 24, 2026
Source: TradingView
On the one-hour (H1) chart, price is sitting right on the 200-hour moving average at 7,723 after a run of lower highs. RSI has dropped to about 25, deep in oversold territory, and has flagged a bullish divergence.
In simple terms, selling is slowing down even as price makes new lows. The 100-hour moving average near 7,783 is now the first big ceiling.
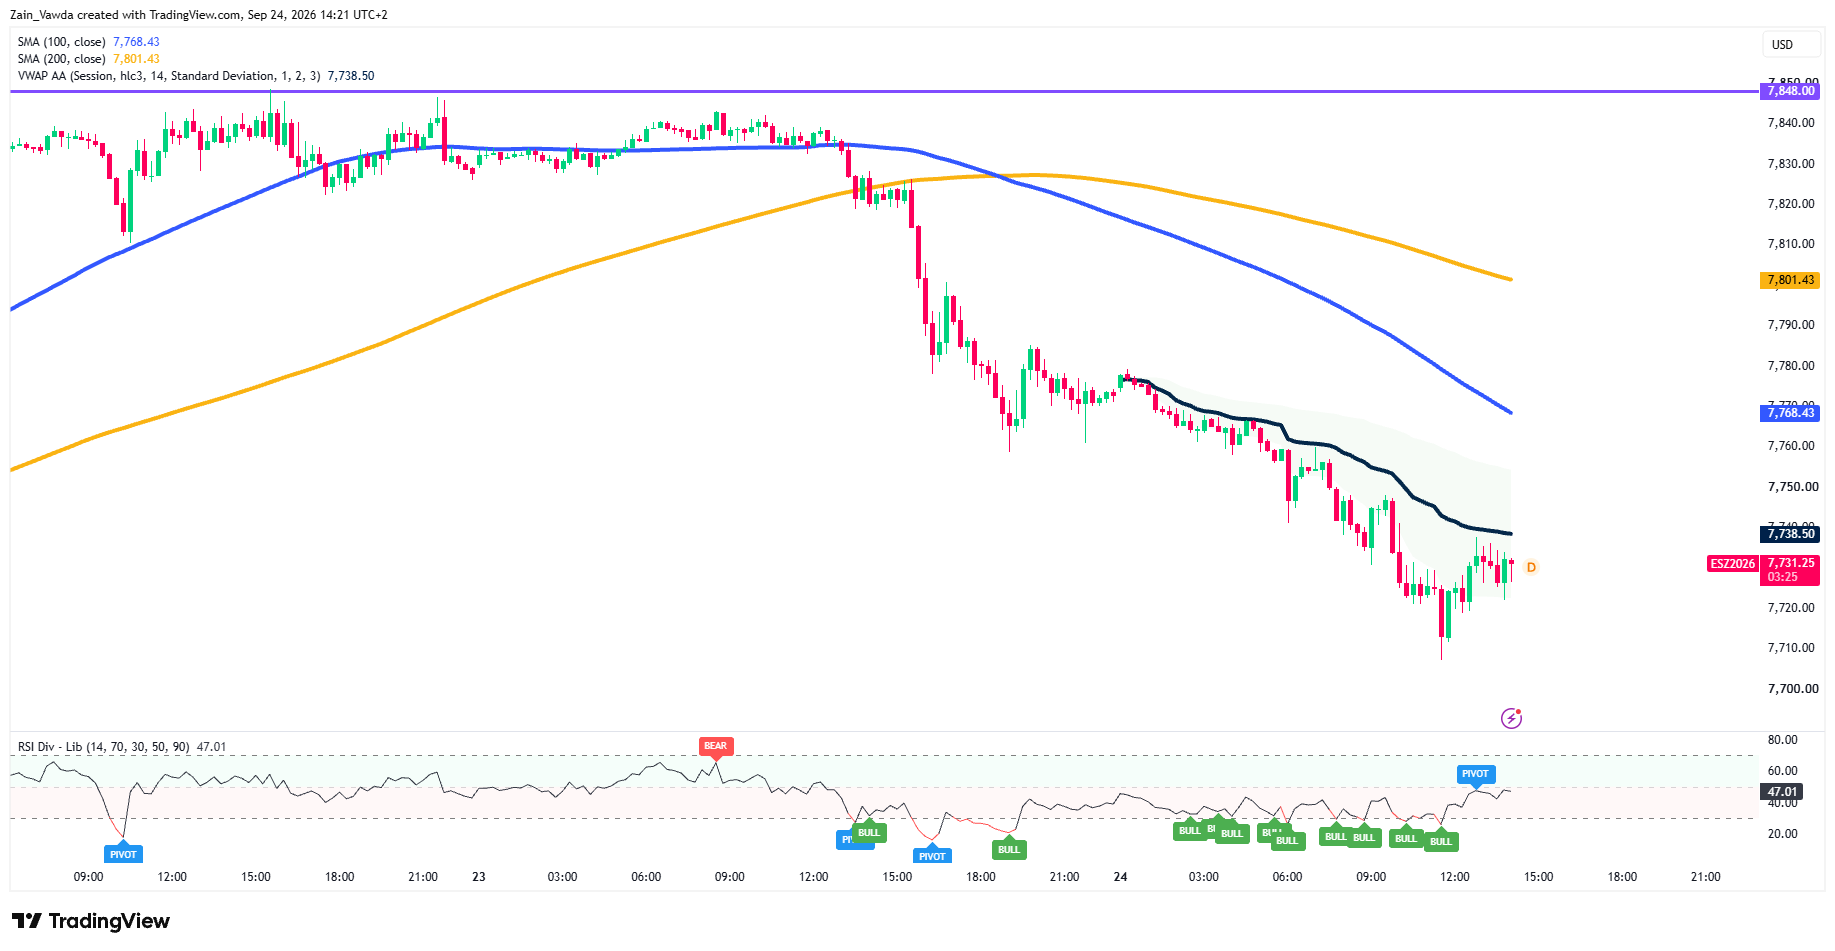
15-Minute Chart: VWAP Decides the Open
S&P 500 Four-Hour Chart, September 24, 2026
Source: TradingView
The 15-minute (M15) chart shows sellers still in control, with price under both falling moving averages (7,768 and 7,801). But the overnight low near 7,708 was bought, and RSI has printed several bullish divergence signals.
The key line for the open is the session VWAP at 7,738.50, the average price paid today. Holding above it would signal buyers are taking over.
Failing below it keeps sellers in charge.
Outlook: Today’s U.S. Session
The 7,700 area is the line in the sand. The charts point to oversold conditions and a possible bounce, but the bond market is in charge. If yields keep rising after jobless claims, support may not hold.
Potential Scenario Matrix
| Scenario | Trigger | S&P Implications |
|---|---|---|
| Bull | Softer claims, yields ease, positive summit headlines | Reclaim VWAP 7,738.50, then 7,768 and 7,783–7,800 |
| Base | Data in line, yields steady near 5.1% | Choppy range between 7,700 and 7,770 |
| Bear | Strong claims, 10-year above 5.15%, summit disappointment | Break below 7,700 opens 7,650, then 7,600 |
Trader Positioning Data
Marketframework Positioning Edge Tool data is flashing a strong bearish divergence. Profitable traders are 9% more short than unprofitable traders, holding 55% long exposure versus 64% among unprofitable accounts.
This positioning split demonstrates disciplined accounts favoring short exposure above current prices while retail traders attempt to catch a falling knife, reinforcing ongoing downside momentum.