The Nasdaq 100 (NDX) just did something which it isn't supposed to do. It hit a fresh all-time high, the first since late June, amid a Federal Reserve rate-tightening cycle.
The Nasdaq E-mini futures (NQ) tied to the NDX also scaled a fresh high above 31,000, extending a breakout seen since mid-September. On Sept. 16, the Federal Open Market Committee (FOMC), led by Chair Kevin Warsh, raised the Fed Funds Target rate by 25 basis points to a range of 3.75%-4.00%, marking the first hike since 2023. The verdict was made unanimously and the updated projections pointed to at least one more hike before the year end. The central bank also nudged up its inflation forecasts, underpinned by higher energy costs tied to the U.S. war with Iran.
This is an unusual setup, given most of the tech sector’s multi-year run has been built on hopes of lower rates. The most recent leg higher is occurring with rates moving the other way. Therefore, the market is forced to rely on its one pillar of support, namely artificial intelligence (AI)-driven earnings growth, and the belief that it can outrun a rising cost of capital.
That’s a tall order, and that’s why the path forward likely comes down to three specific tests that will likely play out in the short term.
One Chart
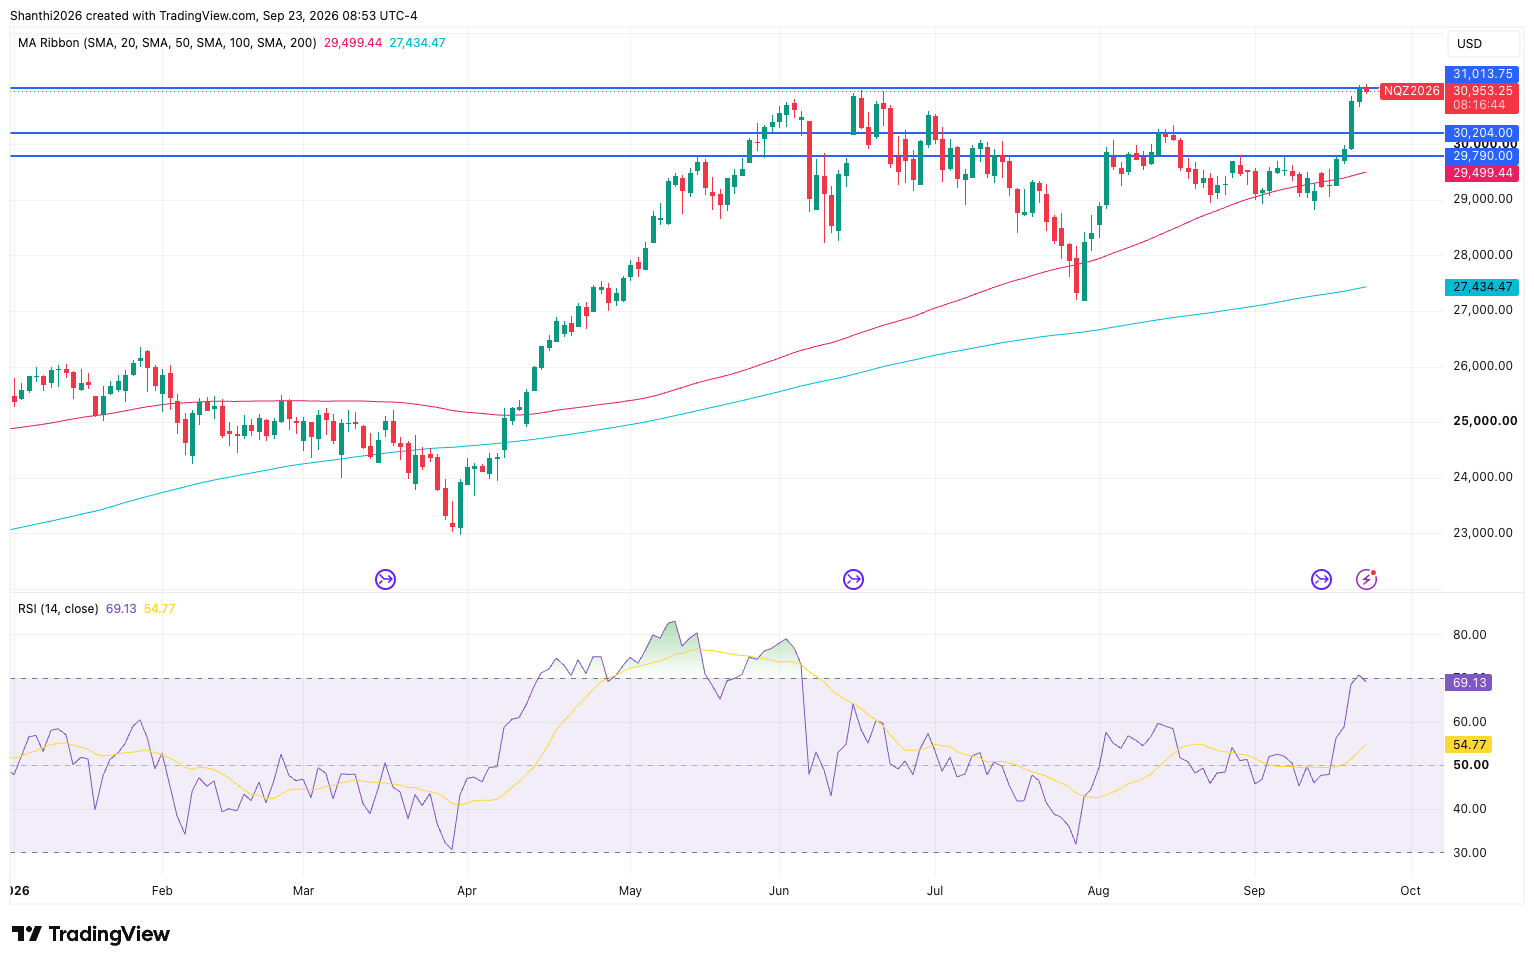
With the NQ contract having broken above the 31,000 psychological resistance, the first major test in the eventuality of a pullback is whether it can sustainably stay above the level. The 29,800-30,200 band, the ceiling the contract fought through to successfully challenge its previous high, is now the next level the bulls have to defend. Holding above it would confirm that the breakout is structural, and not a knee-jerk squeeze. Losing it would raise the odds that this record run was a failed test, rather than a genuine new leg higher.
Source: TradingView
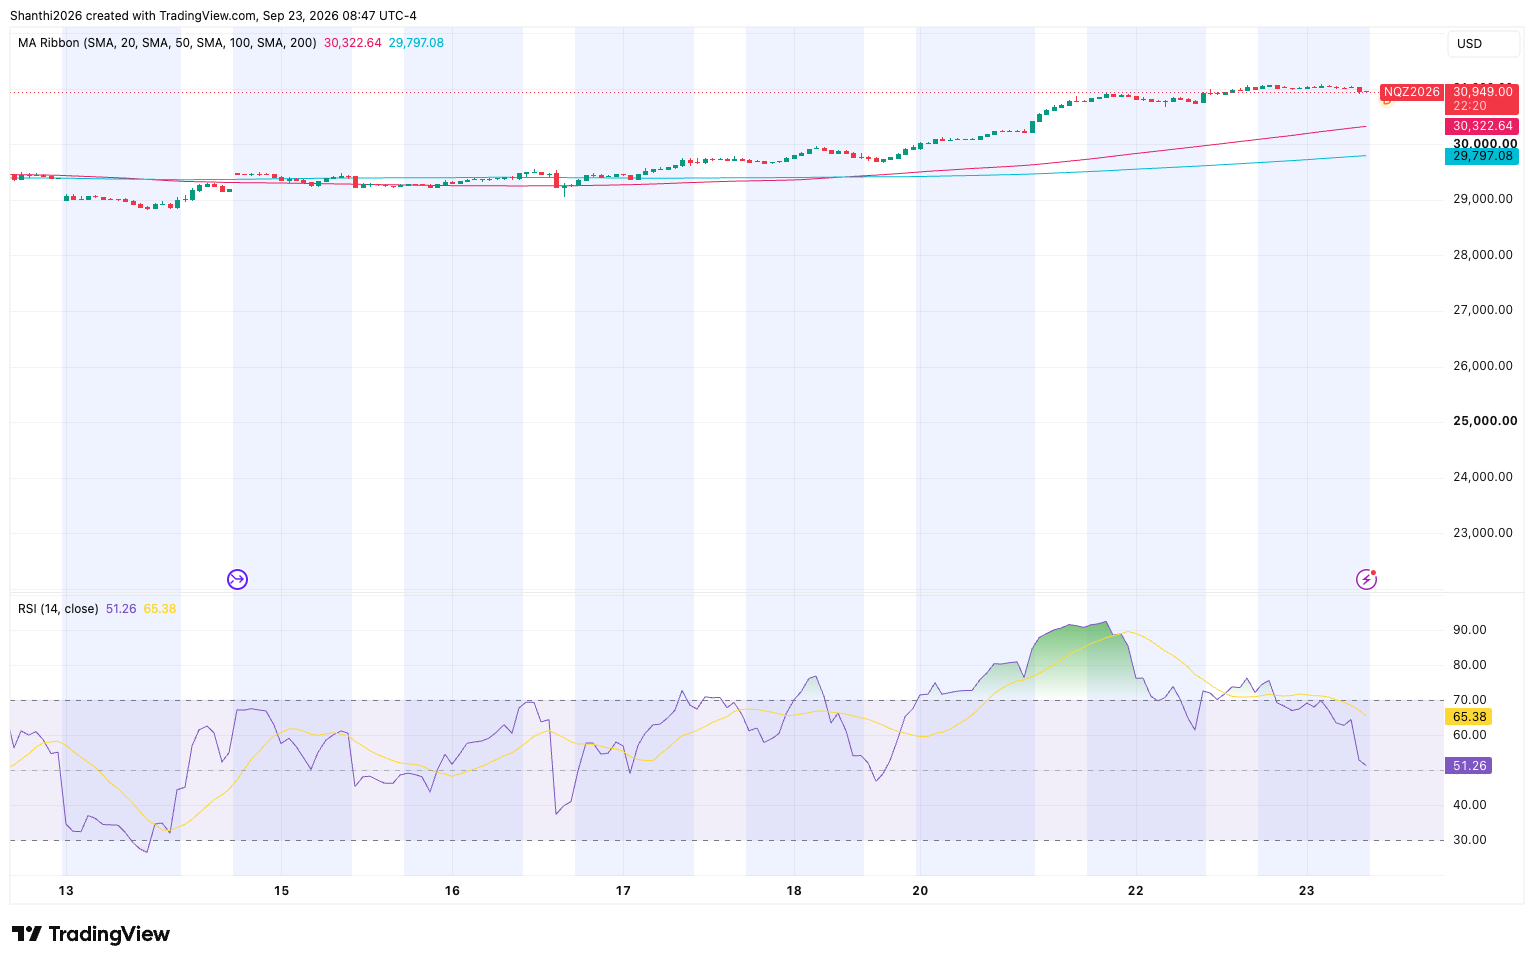
The H1 chart shows the trend is intact and the price is still above a rising ribbon, suggesting the pullback seen Wednesday morning is a healthy pause than a top, provided the 100-period simple moving average (SMA) (around 30,322) holds as support on any dip.
Source: TradingView
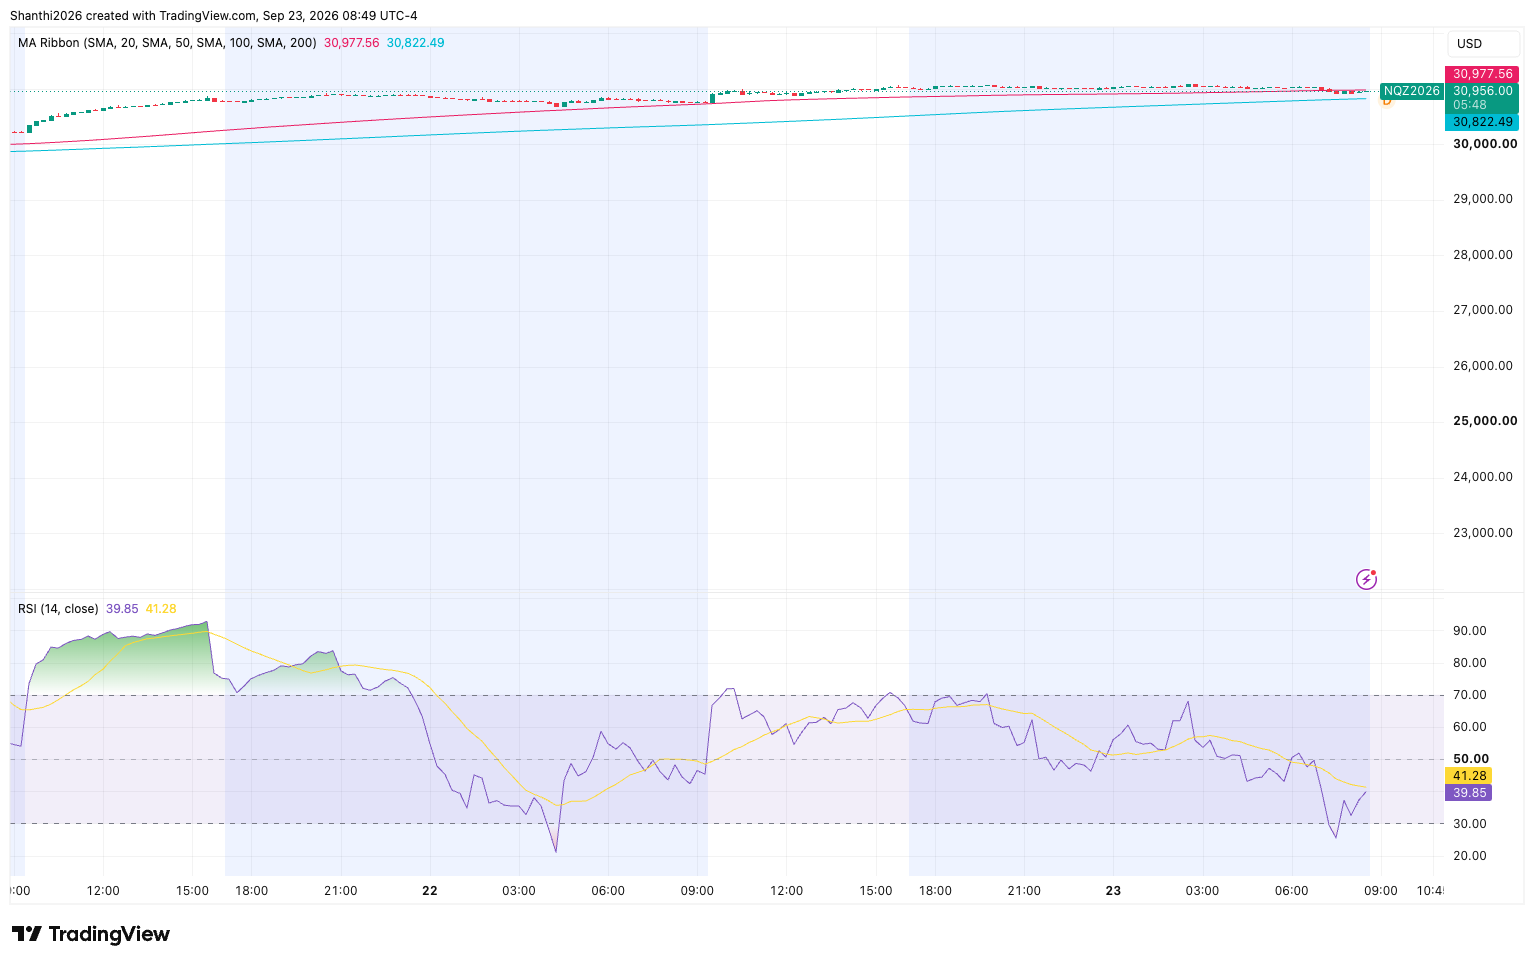
But the near-term reveals exhaustion at resistance. The sharp drop in the relative strength index (RSI) (38.38) versus the contract holding near 31,000 shows buyers are struggling to extend the move without a correction first.
The moving-average structure reinforces that caution. NQ has slipped below its 100-period SMA but remains above the 200-day SMA, putting the contract between two important technical reference points. A break below the 100-period average signals weakening near-term momentum, while the 200-day SMA can act as a deeper support zone. Unless NQ decisively loses the longer-term average, the setup looks more consistent with choppy trade or a shallow pullback within the broader uptrend than an immediate trend reversal.
Source: TradingView
MarketFramework’s Positioning Edge tool points to a modestly bullish bias among NQ futures traders. Overall sentiment is slightly above neutral, with the more successful cohort leaning more bullish at 57.9% long, compared with 42.6% long among unprofitable traders.
With NQ trading at 30,953.50, the contract is above the profitable traders’ average long-entry level of 30,912, suggesting this cohort is currently sitting on a modest unrealized gain. At the same time, NQ remains below the unprofitable traders’ average long-entry level of 30,977, leaving this cohort slightly underwater. The positioning therefore offers a mildly constructive signal: profitable traders are holding longs that are already in the money, while the less successful cohort would need a move above 30,977 to return to breakeven.
One Fed Meeting
Warsh has been the most hawkish Fed Chair markets have dealt with in years, with the dot plot, which does not include his projection, still showing room for another hike in 2026. The next policy meeting will show whether that path holds or whether softer data gives the Fed room to pause.
Given how much of the current rally has happened despite higher rates, any confirmation of further tightening is a real test of how much more the market can absorb.
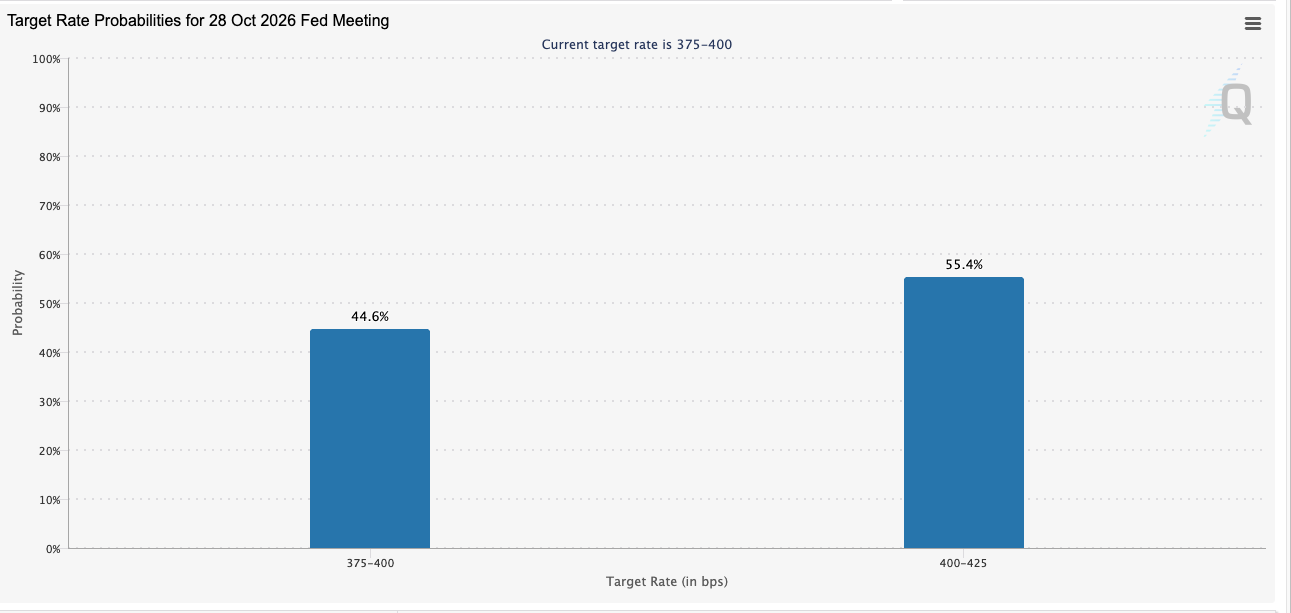
The next FOMC meeting is scheduled for Oct.27-28, and it would not be accompanied by updated Fed staffers’ forecast, leaving the market to parse only the nuances of the policy statement and Warsh’s post-meeting press conference. The CME FedWatch tool now puts the odds of a quarter-point hike at 55.4%.
Fed Fund Target Rate Probabilities
Source: CME Group
Between now and the next meeting, the markets get to digest a price consumption expenditure (PCE) data, dropping as early as next week, a consumer price inflation (CPI) report, and a monthly non-farm payrolls (NFP) report.
Fed speeches since the September meeting have been bordering on hawkishness, with several officials voicing their extreme concerns about elevated inflation.
One AI Earnings
Memory chipmaker Micron is scheduled to report its fiscal fourth-quarter results next Wednesday. The earnings print will be the cleanest read investors will get on whether AI-driven memory and infrastructure demand is still accelerating or starting to level off. A strong beat-and-raise would reinforce the idea that AI earnings can carry the market even as rates rise. A cautious print or management commentary would revive the same capex-versus-payoff anxiety that rattled sentiment after Oracle’s capex spending disclosure earlier this month, this time with fresher, market-moving timing.
None of these three, on their own, is likely to end the rally outright. But together, they are the actual mechanism behind the next move in NQ — a technical level, an earnings print and a policy signal all landing in the same window. That’s what makes the near term more consequential than the record high itself.