The Nasdaq kept climbing on Tuesday while the rest of Wall Street went sideways. The Nasdaq 100 Futures (NQ) closed just above the 31,000 handle, lifted by a sixth straight day of gains in chip stocks. The S&P 500 finished almost flat at 7,764.64, while the Dow slipped 185 points (0.36%) to 51,863.69 as bank shares sold off.
The drivers were the same as Monday: falling oil and hopes for a deal between the US and Iran.
Oil Falls for a Fifth Day
Brent settled 1.1% lower at $99.25 and WTI fell 1.2% to $94.59, a fifth straight loss for both.
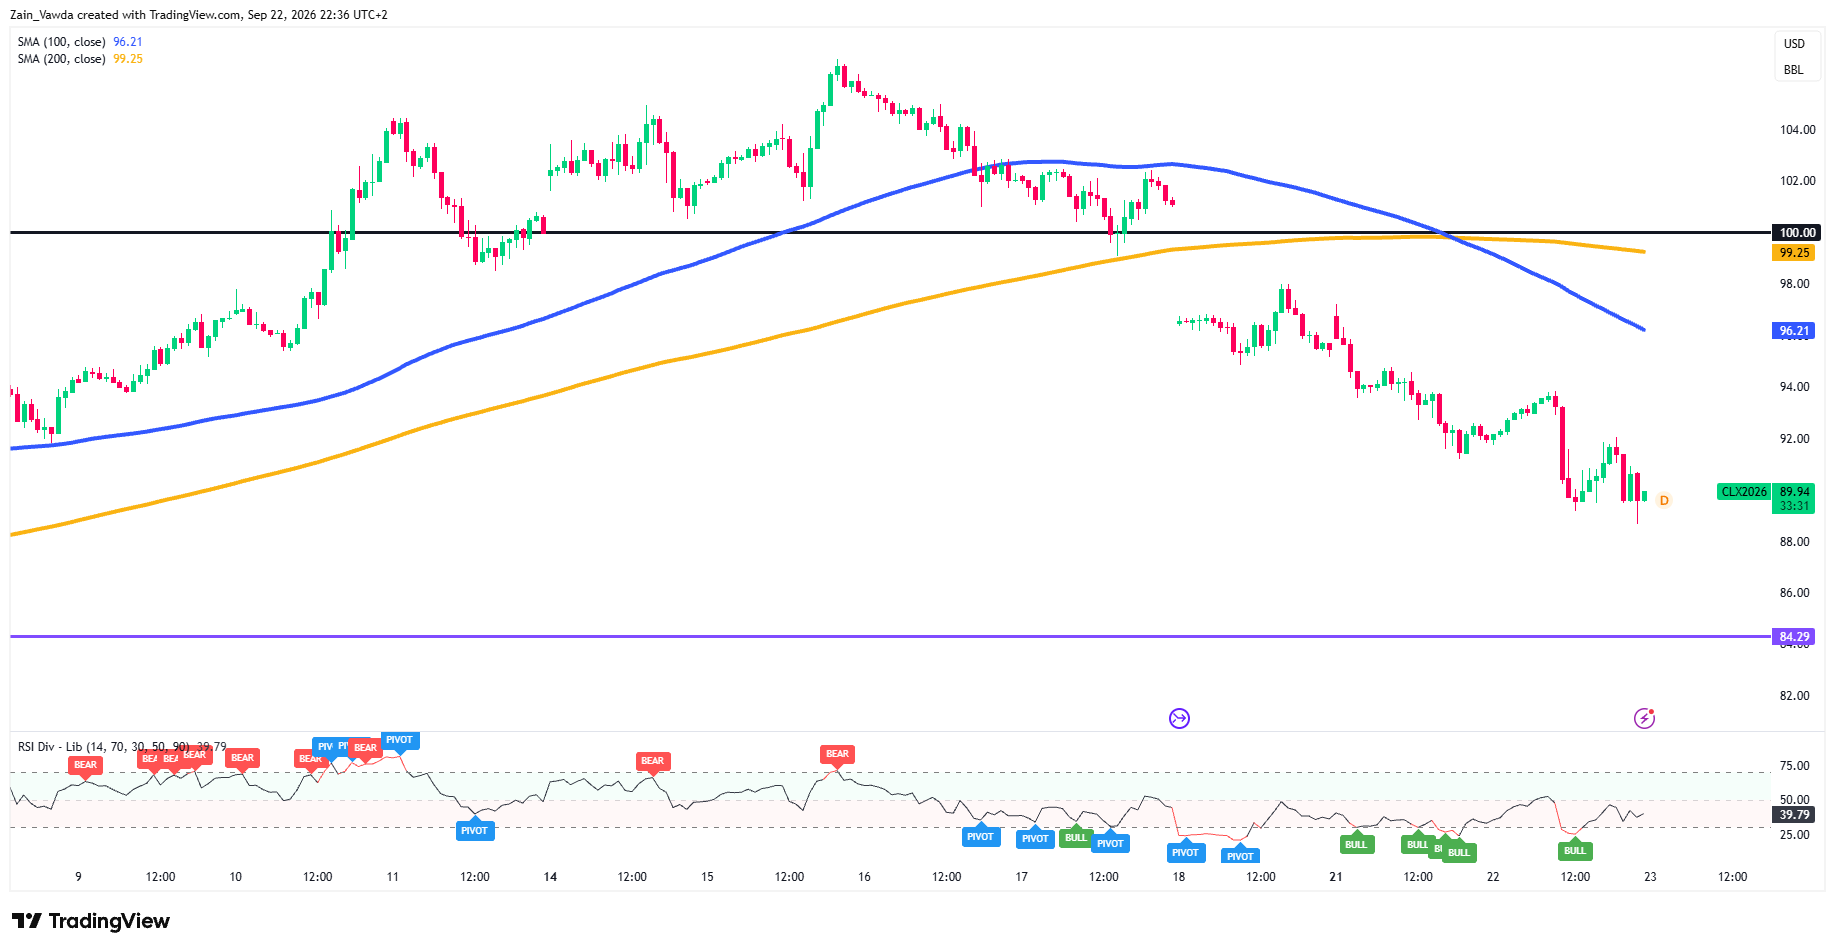
Oil (CL) One-Hour Chart, September 22, 2026
Source: TradingView
Looking at Oil H1 chart and the trend is down: price gapped lower from the $100 area on September 18 and keeps making lower highs.
The 100-period average (96.21) has crossed below the 200-period average (99.25), and $100 has flipped from floor to ceiling.
There is one caution for sellers: the RSI (39.8) is showing bullish divergence, meaning the selling is slowing. Support sits at 88.00 and then 84.29. Resistance is 92.00, then 94.00.
President Trump said US officials held a "very good" three-hour meeting with Iranian envoys on the sidelines of the UN General Assembly, and that another meeting is being planned. Reports that Iran offered to reopen the Strait of Hormuz within seven days added to the selling.
Saudi Arabia is also reportedly planning to restart its East-West pipeline, which lets it ship crude without going through Hormuz, as early as this week.
The message was not all soft, though. At the UN, Trump said he has a "big decision" to make between a deal and attacking Iran, and said he expects a deal after the November midterm elections.
So traders are pricing progress, not a signed agreement.
Chips Lead, Banks Lag
Under the surface this was a rotation, not a broad rally. Micron and Nvidia helped the main semiconductor index to its sixth gain in a row, and Sandisk jumped about 7% after a bullish call from Rosenblatt.
Banks went the other way, which kept the Dow in the red. Bloomberg's Michael Ball noted that leadership has swung back to chipmakers, but a stronger rally needs more stocks to take part.
The Fed Is Still in Hiking Mode
Cheaper oil helps the inflation outlook, but the Fed raised rates by a quarter point last week and officials are not hinting at a pause.
Boston Fed President Susan Collins backed the hike, and Richmond's Tom Barkin warned that inflation shocks can take time to fade. The 10-year Treasury yield sat around 4.94%–4.96%, just below last week's 19-year high above 5%.
RBC Wealth Management's Tom Garretson warned that markets may be too relaxed about the 10-year pushing above 5% and the risk of two more hikes.
Nasdaq Technical Outlook (H1)
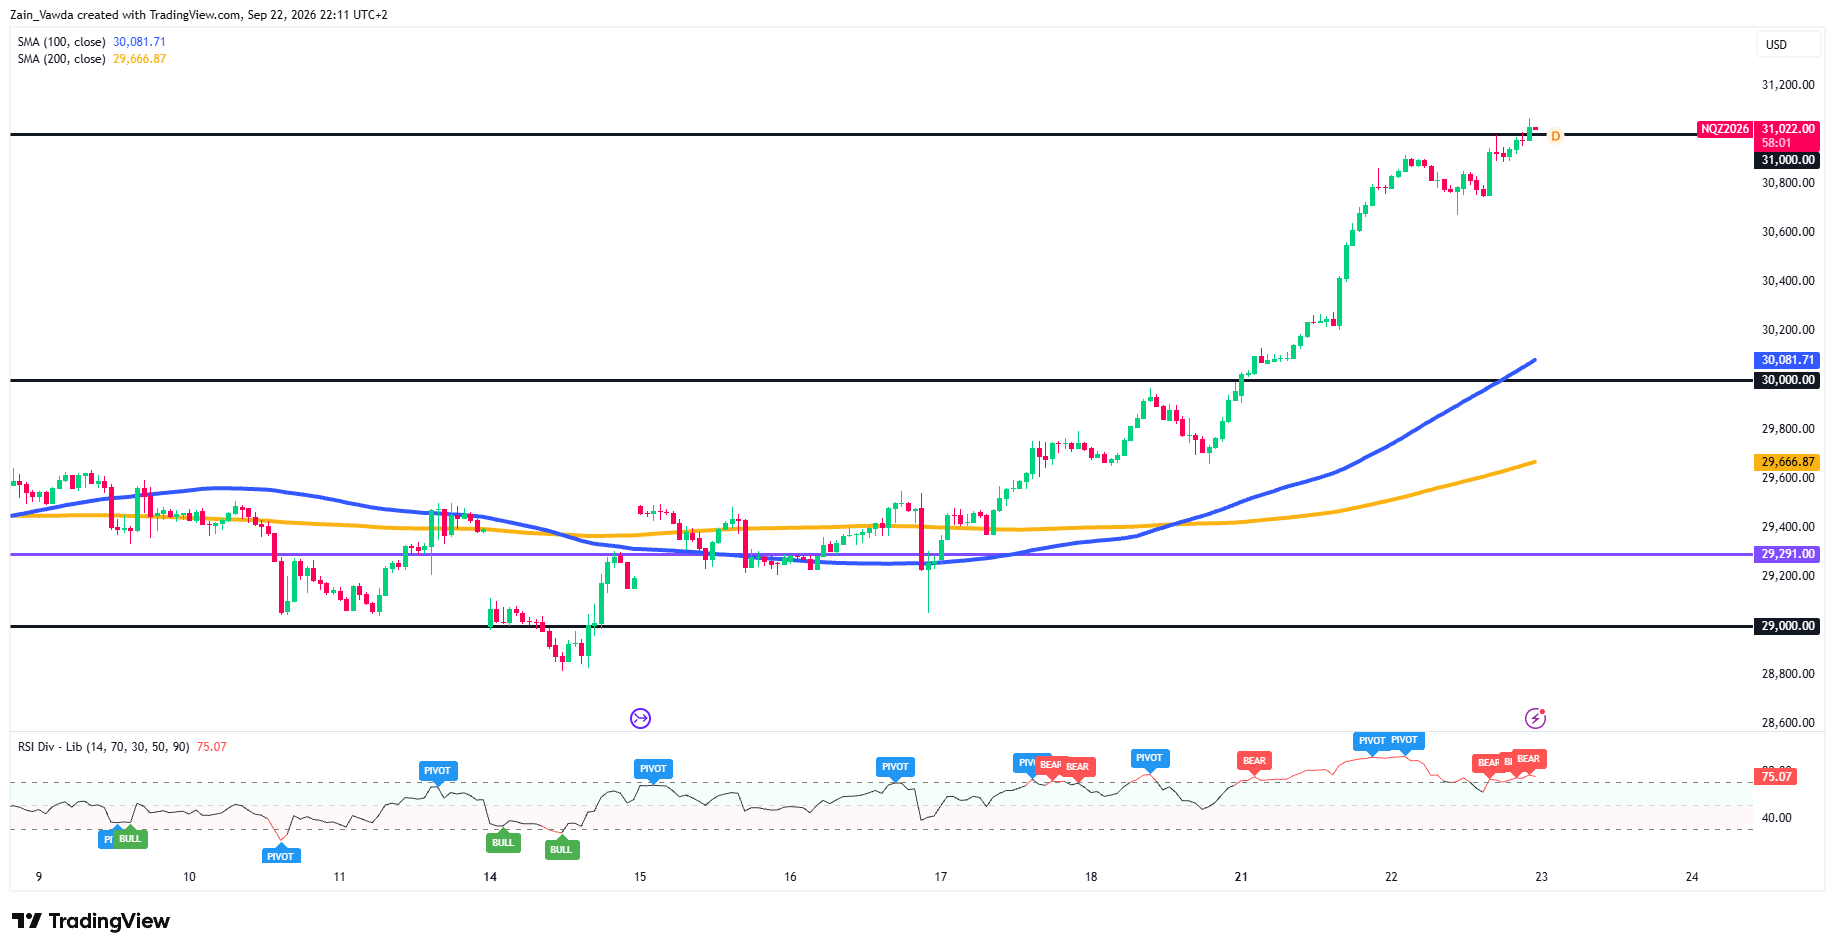
December Nasdaq futures (NQZ2026) pushed just above 31,000, a round number that capped the market earlier Tuesday.
Nasdaq 100 (NQ) One-Hour Chart, September 22, 2026
Source: TradingView
The trend is strong: the 100-period average (30,082) crossed above the 200-period average (29,667) last week, a sign the trend has turned up.
But the RSI, a momentum gauge, is at 75, which is overbought, and it shows bearish divergence: price is making higher highs while momentum makes lower highs. That points to a tired rally.
Holding above 31,000 opens 31,200. A failure brings 30,800 (Tuesday's dip) and then 30,000, where the breakout began.
Scenarios Into the Next Iran Meeting and the Trump–Xi Summit (Sept 24)
| Scenario | What May Happen | Nasdaq | Oil |
|---|---|---|---|
| Bull | Talks confirm a ceasefire step or Hormuz reopening; summit is friendly on tariffs and rare earths | Holds 31,000, targets 31,200+ | Breaks 88.00, eyes 84.29 |
| Base | More talk, no deal before the midterms; summit is mostly handshakes | Chops 30,800–31,200 as momentum cools | Ranges 88.00–94.00 |
| Bear | Talks stall or the Hormuz report is denied; summit disappoints | Slips back toward 30,000 | Rebounds to 94.00–96.21 |
For the Trader
The question to ask is whether profitable traders are chasing NQ above 31,000 while momentum fades, or waiting for a pullback; and whether they are pressing CL shorts near $89 or taking profit into the bullish divergence.
Keep an eye on the latest data using the Positioning Edge Data Tool on MarketFramework.