A short-lived spike to $98 failed to sustain momentum, sending crude oil (CL) back toward its $95 base during the U.S. session.
As the week closes out, the primary focus isn't on upside potential, but whether buyers can defend $95 support against another test.
What’s Actually Moving the Price
Last week a drone strike damaged pumping stations on Saudi Arabia’s East-West Pipeline, the line that carries crude across the country to Red Sea ports so it can skip the crowded Strait of Hormuz.
Satellite images and industry sources now count three stations hit, one more than first thought, and the repair timeline is still uncertain: anywhere from a partial restart in days to five or six weeks of work. Aramco has told at least two European refiners they’ll get no crude next month.
What has stopped this becoming a runaway rally is the response. Saudi Arabia is moving oil tanker-to-tanker at sea (a “ship-to-ship transfer”) via Oman’s Sohar port to Asian buyers, which capped the panic and dragged crude back under $100 midweek.
On top of that, Wednesday’s Fed rate hike, with officials now pencilling in 4.1% by year-end lifted the U.S. dollar, and a stronger dollar is a headwind for oil because crude is priced in dollars.
Inventories were mixed, and China’s refined-product exports jumped 12.7% year-on-year in August, adding fuel supply though diesel refining margins sit at their highest since 2009, a quietly bullish undercurrent.
The Technical Picture: H4 and H1
The bigger trend is still up, but the short-term picture has turned cautious and read together, the two time frames put the whole trade on one number: $100.
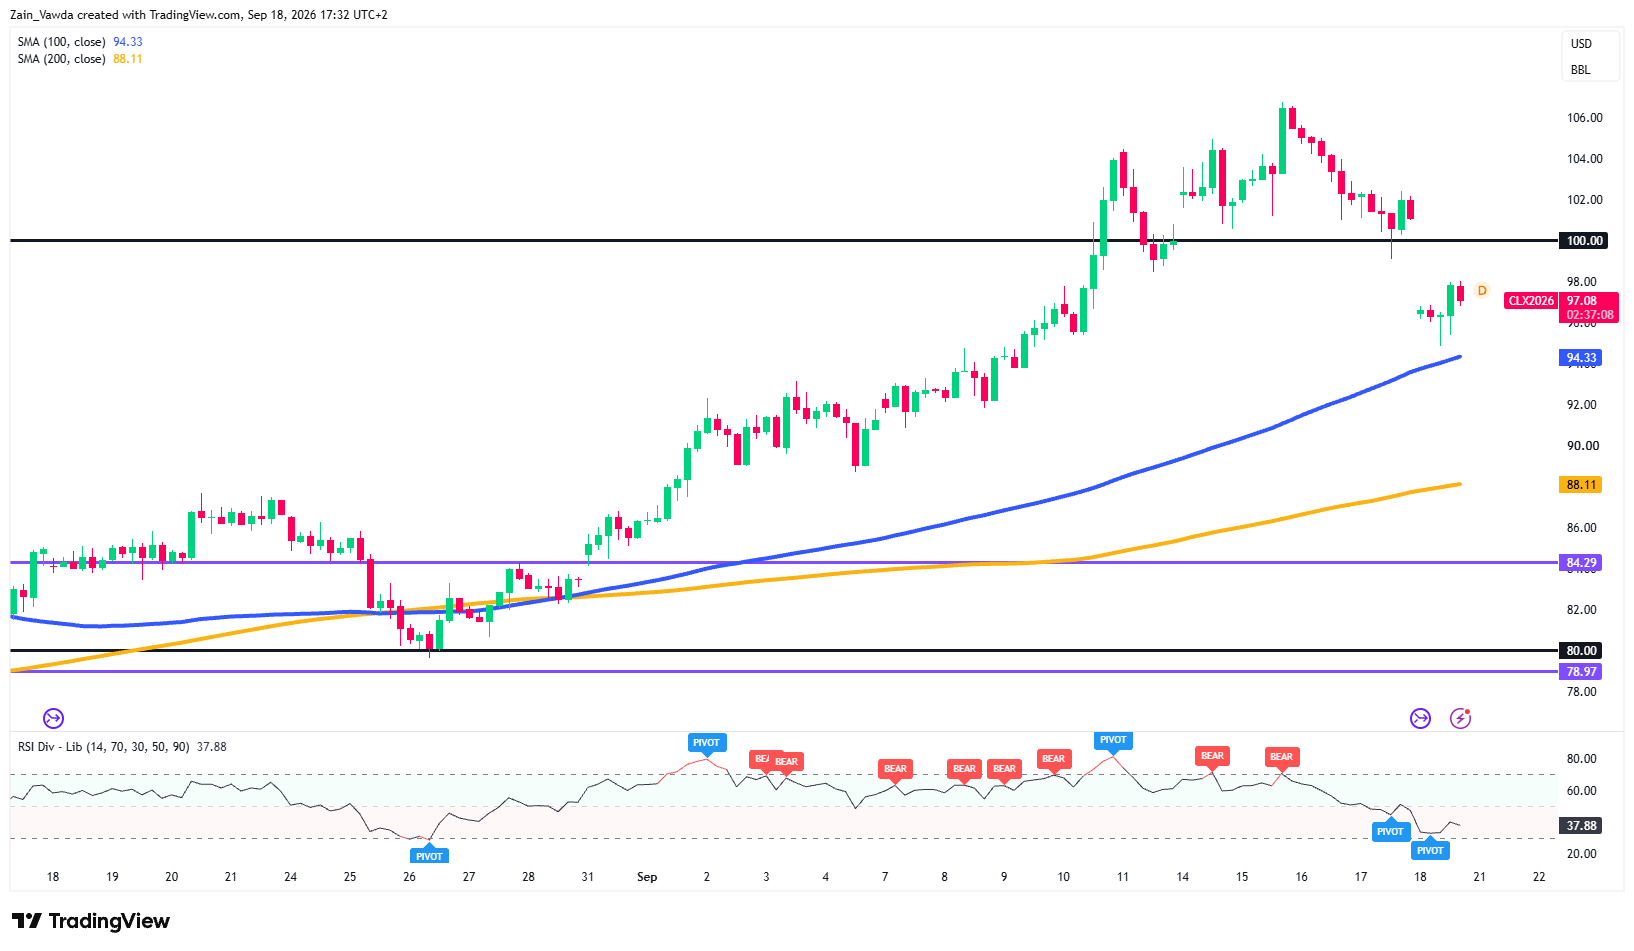
On the 4-hour (H4) chart the uptrend is intact. November crude is still holding above both its 100-period moving average ($94.33) and its 200-period average ($88.11), and both are rising and correctly stacked, the faster line above the slower one. But this has been a sharp pullback: price fell from a peak near $106.50 on Sept. 15-16, sliced through the $100 line, and is now trying to base around $95, just above that rising 100-period average.
The H4 momentum gauge (RSI) dropped near 38, close to oversold and is only now trying to curl back up.
Oil (CL) Four-Hour Chart, September 18, 2026
Source: TradingView
On the 1-hour (H1) chart, the caution is obvious. Price is trading below both its 100-period ($101.75) and 200-period ($99.69) averages, which sit stacked together right around the $100 mark, a wall of resistance directly overhead.
The encouraging part: the H1 RSI (near 44) is showing a bullish divergence off the $95 low, a hint the selling is tiring. But until crude reclaims that $99.70–$101.75 band and the round $100 with it, the near-term bias stays corrective.
Lose $95 and the H4 100-period average at $94.33 becomes the next line of defence.
Oil (CL) One-Hour Chart, September 18, 2026

Source: TradingView
The nearest catalyst is the weekend itself: two days of possible Saudi–Houthi headlines and the first hard read on repair progress, all while the market is closed. That is exactly the setup that produces a Sunday gap.
Scenario Map Into the Weekend
| Scenario | What Sets It Off | Likely Path Into Next Week |
|---|---|---|
| Bull | Fresh weekend strikes or a repair delay while the market is closed | Sunday gap higher, reclaim $100 and the $99.70–$101.75 wall, run at $104 then $106.50 |
| Base | Workaround holds, no major escalation over the weekend | Capped under $100, chops between $95 and the wall; waits on Monday’s repair news and inventories |
| Bear | A credible “pipeline restarting” headline plus a firmer dollar | Rejected at $100, lose $95 and the $94.33 average, correction extends lower |
The classic account killer here is carrying a naked long over the weekend into gap risk, when the single biggest driver, a repair headline can print while the market is shut.
Decide your invalidation ($95 for longs) before the close, not after Sunday’s open.