Wednesday comes in two acts. The morning is data; the afternoon is the decision. And for once the warm-up act might matter as much as the headliner, because the last big number lands just five and a half hours before the Fed tells us what it's doing.
The One that Counts: August Retail Sales (8:30 AM ET)
This is the print traders will actually trade. Consensus looks for a +0.9% month-on-month rebound after July's −0.6% drop, with the "control group" (retail minus cars and gas, the bit that feeds directly into GDP) seen around +0.6% vs −0.3%.
Retail sales measure what Americans spent at shops, online and in restaurants and since consumer spending is roughly 70% of the US economy, a strong number says the economy can take higher rates, while a weak one hands the doves a last-minute argument.
One caution worth a second look before you publish: the forecasts are unusually scattered this month, with at least one calendar carrying a negative headline estimate.
Treat +0.9% as the consensus, not gospel, and check the actual against it.
The Inflation Tell in Import Prices (8:30 AM ET)
Dropping alongside retail sales are import and export prices, the cost of goods crossing the U.S. border.
Imports are seen +0.4% vs −0.4% prior and exports +0.5% vs −1.3%. With tariffs and elevated oil already in the mix, a firm reading keeps the "inflation is still above target" story alive, which is exactly the story that argues for a hike.
The Rest of the Board
The morning also brings homebuilder sentiment via the NAHB index (10:00 AM), weekly EIA crude inventories (10:30 AM) and, after the close, July TIC flows (4:00 PM), the last of these a read on whether foreigners are still buying U.S. assets, which matters more than usual with the 10-year Treasury yield sitting around 5%, its highest since 2007. That yield is quietly doing some of the Fed's tightening work for it.
Technical Analysis - Nasdaq 100 (NQ) Coils Under Resistance Into the Fed
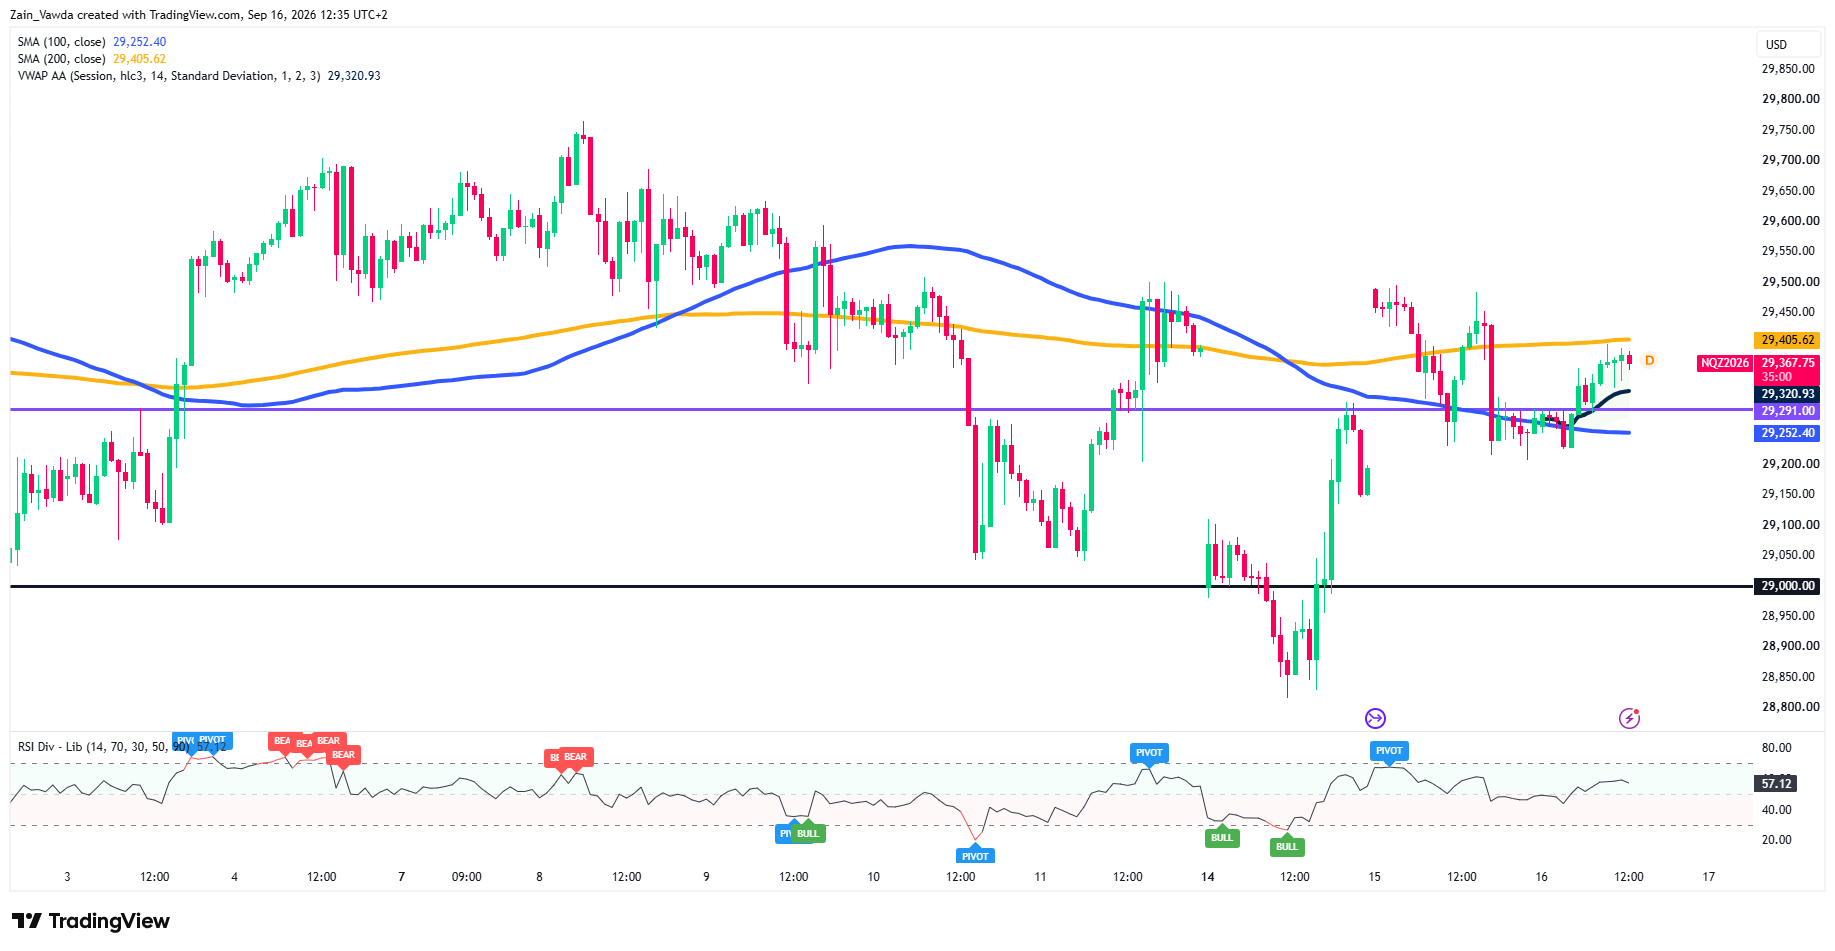
The one-hour chart (the bigger picture): The moving averages are still in a bearish setup here — the faster 100-period average (29,252) sits below the slower 200-period average (29,405), the footprint of that Sep 11–14 flush that briefly cracked below 29,000 to ~28,820 before buyers reclaimed it.
Nasdaq 100 One-Hour Chart, September 16, 2026
Source: TradingView
Since then price has clawed all the way back and is now pressing into the 200-SMA at ~29,405 from underneath. That line is the single most important level on the board: it's the ceiling that decides the pre-Fed bias. RSI at 57 is constructive but not stretched, so there's fuel, the question is whether it's enough to punch through a falling average.
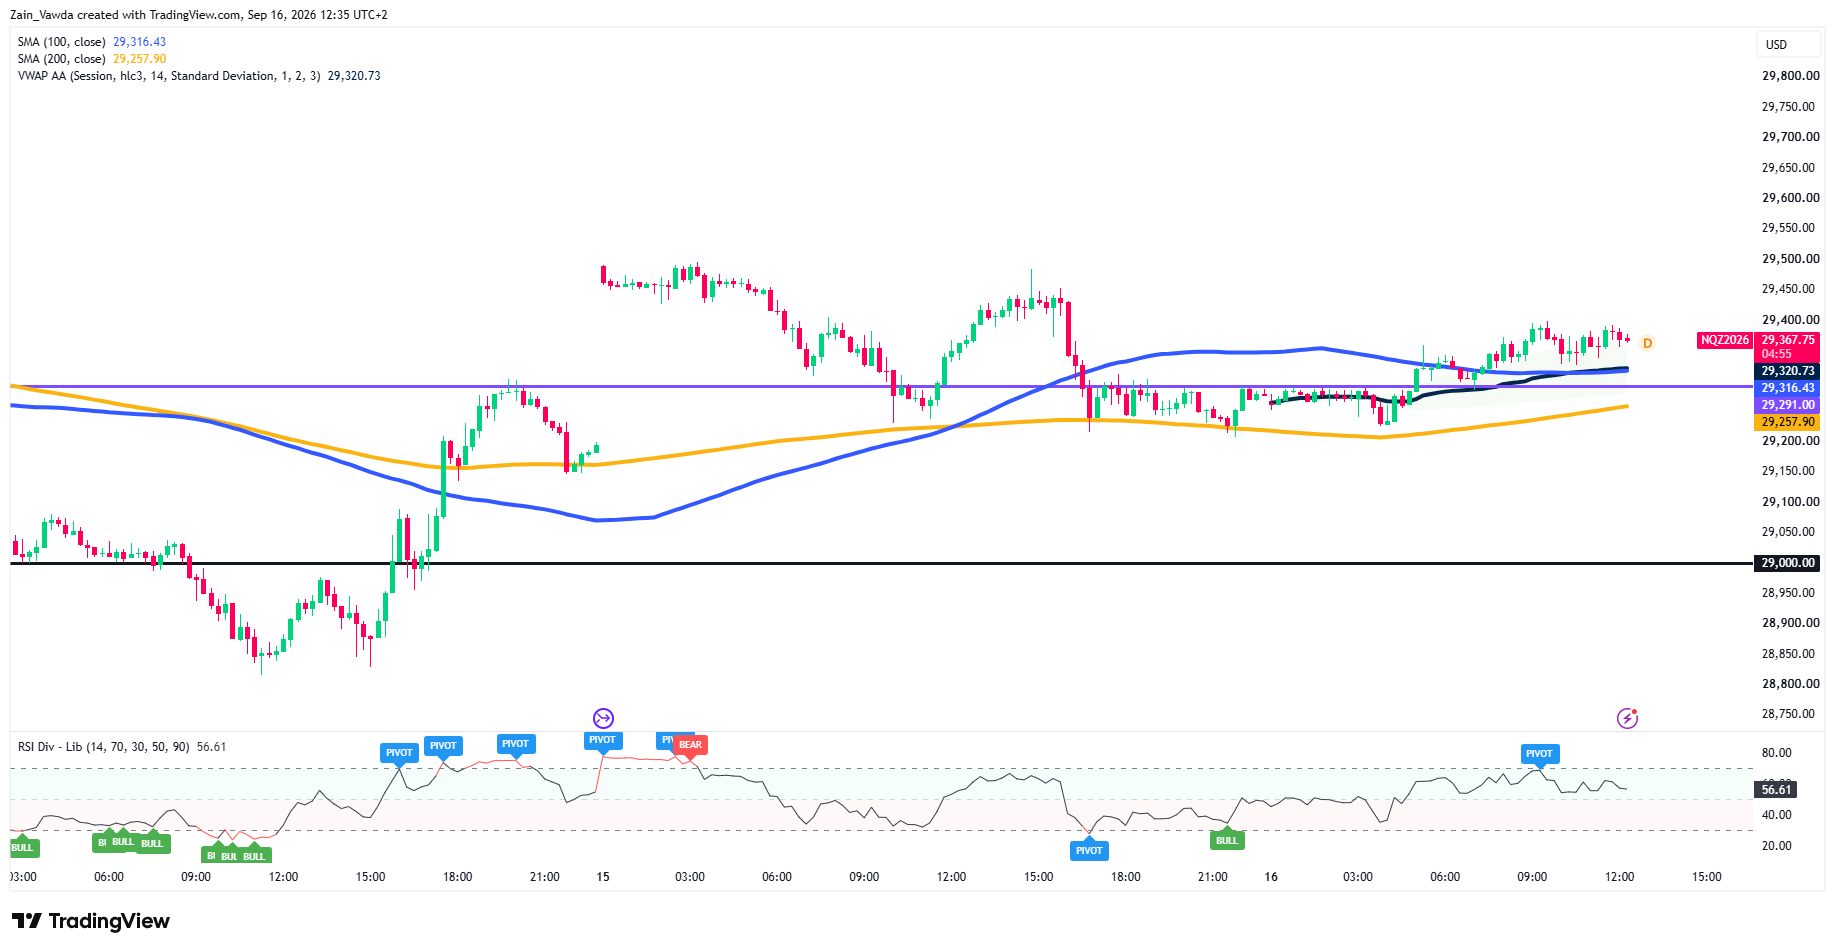
The 15-minute chart (the short-term engine): Here the picture flips bullish. The 100-SMA (29,316) has crossed back above the 200-SMA (29,258), and price is trading above both plus above session VWAP (29,321), the "fair value" line for the day.
Nasdaq 100 M15 Chart, September 16, 2026
Source: TradingView
This morning's grind up from the 29,290 shelf is what's driving price straight into that H1 ceiling. Worth noting: the last time NQ printed a fresh high on M15 (the ~29,500 spike on the 15th), it came with a bearish RSI divergence, momentum lagging price and rolled over.
This push isn't flashing that warning yet.
Trader Positioning Data
The EXTREME BEARISH DIVERGENCE signal on Nasdaq futures ($NQ) highlights a stark divide between smart money and retail positioning as price pushes higher.
Profitable traders are 17% more short than unprofitable traders, this according to the latest data from MarketFrameworks Positioning Edge Tool.