
Gold has started the week on the back foot. Spot XAU/USD slipped to around $4,263 on Tuesday, down roughly 0.8% on the day and its lowest level in about five weeks. That follows Monday's dip to near $4,253, a one-month low.
Step back and the picture is milder than the headlines suggest: gold is still up around 15% over the past twelve months. It is the last month that has hurt, with a drop of roughly 3.5% pulling the metal well off its record.
The reasons are familiar, so I'll keep them short. The bulk of this piece is the chart. A jump in oil prices (tied to a Saudi pipeline shutdown and fresh Middle East tension) has pushed crude toward four-month highs, and the market is reading that as more inflation in the pipe.
That has hardened bets on a Federal Reserve rate hike on Wednesday, lifted Treasury yields, and firmed the dollar. That is the whole story behind today's slide.
With the Fed decision landing on Wednesday, today's U.S. session is really about positioning, not fireworks. The data slate is light, so price is likely to take its cue from the dollar and yields rather than any single release.
The interesting question is what the charts are setting up for.
The Higher Timeframe (4-Hour): A Clear Downtrend, but Stretched
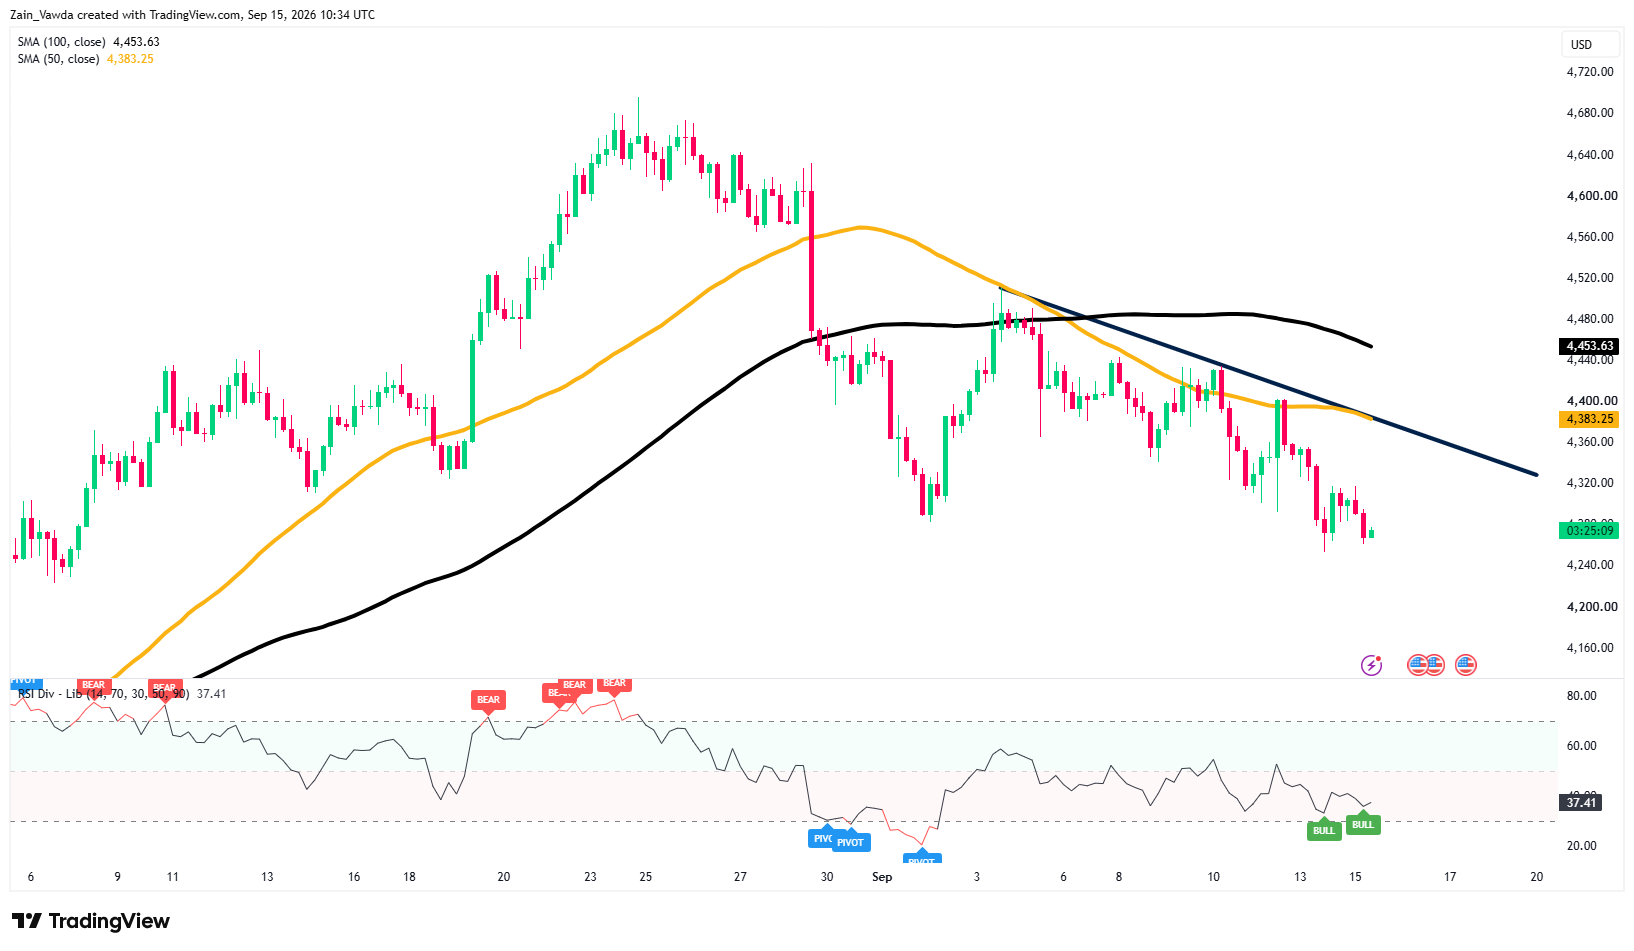
Zoom out to the 4-hour chart and the trend is not in doubt. Price is trading below both its 50-period moving average (near $4,383) and its 100-period moving average (near $4,454). Sitting under both tells you sellers have controlled the recent range.
Gold Four-Hour Chart, September 15, 2026
Source: TradingView
The faster 50-line has now rolled over beneath the slower 100-line, a bearish alignment that usually confirms momentum has shifted lower. On top of that, a descending trendline drawn from the late-August peak near $4,690 is sloping down through roughly the $4,330–$4,360 area, capping every bounce along the way.
So the structure is bearish. But there is a counter-signal worth respecting.
The RSI, a momentum gauge that runs from 0 to 100 sits near 37, close to the oversold zone, and it is showing a small bullish divergence: price has made new lows while the RSI has not.
That is often an early warning that selling pressure is fading, even if it does not flip the trend on its own.
The 1-Hour: Lower Highs, Lower Lows, Layered Resistance
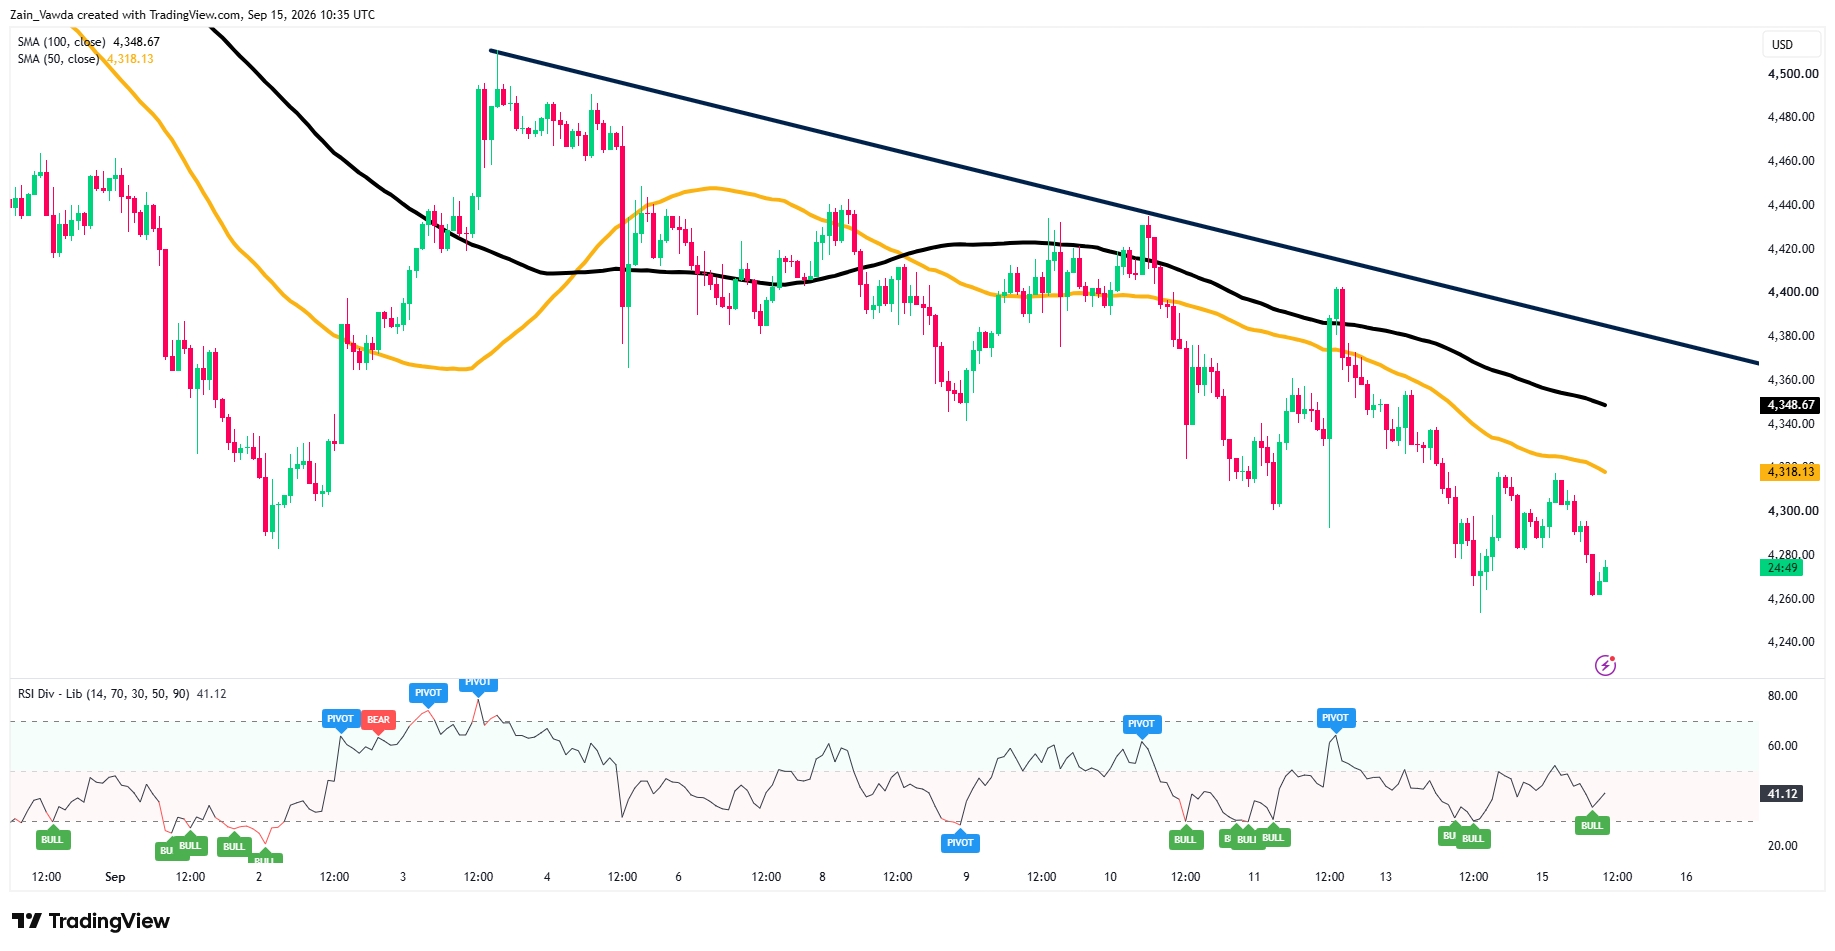
The 1-hour chart tells the same story at closer range. Price is below a declining 50-MA (~$4,318) and 100-MA (~$4,348), and the sequence of lower highs and lower lows through September is intact. A separate descending trendline off the September 3–4 swing high near $4,500 reinforces the ceiling around $4,360.
Gold One-Hour Chart, September 15, 2026
Source: TradingView
What makes this level cluster important is the confluence. The 1-hour 100-MA near $4,348 lines up almost exactly with the widely-watched daily 100-day average around $4,351.
When intraday and daily averages stack on the same price, that band tends to matter more. The 1-hour RSI near 41 again shows the same gentle bullish divergence into the lows.
The 15-Minute: A Coiled Spring Right Under the Line
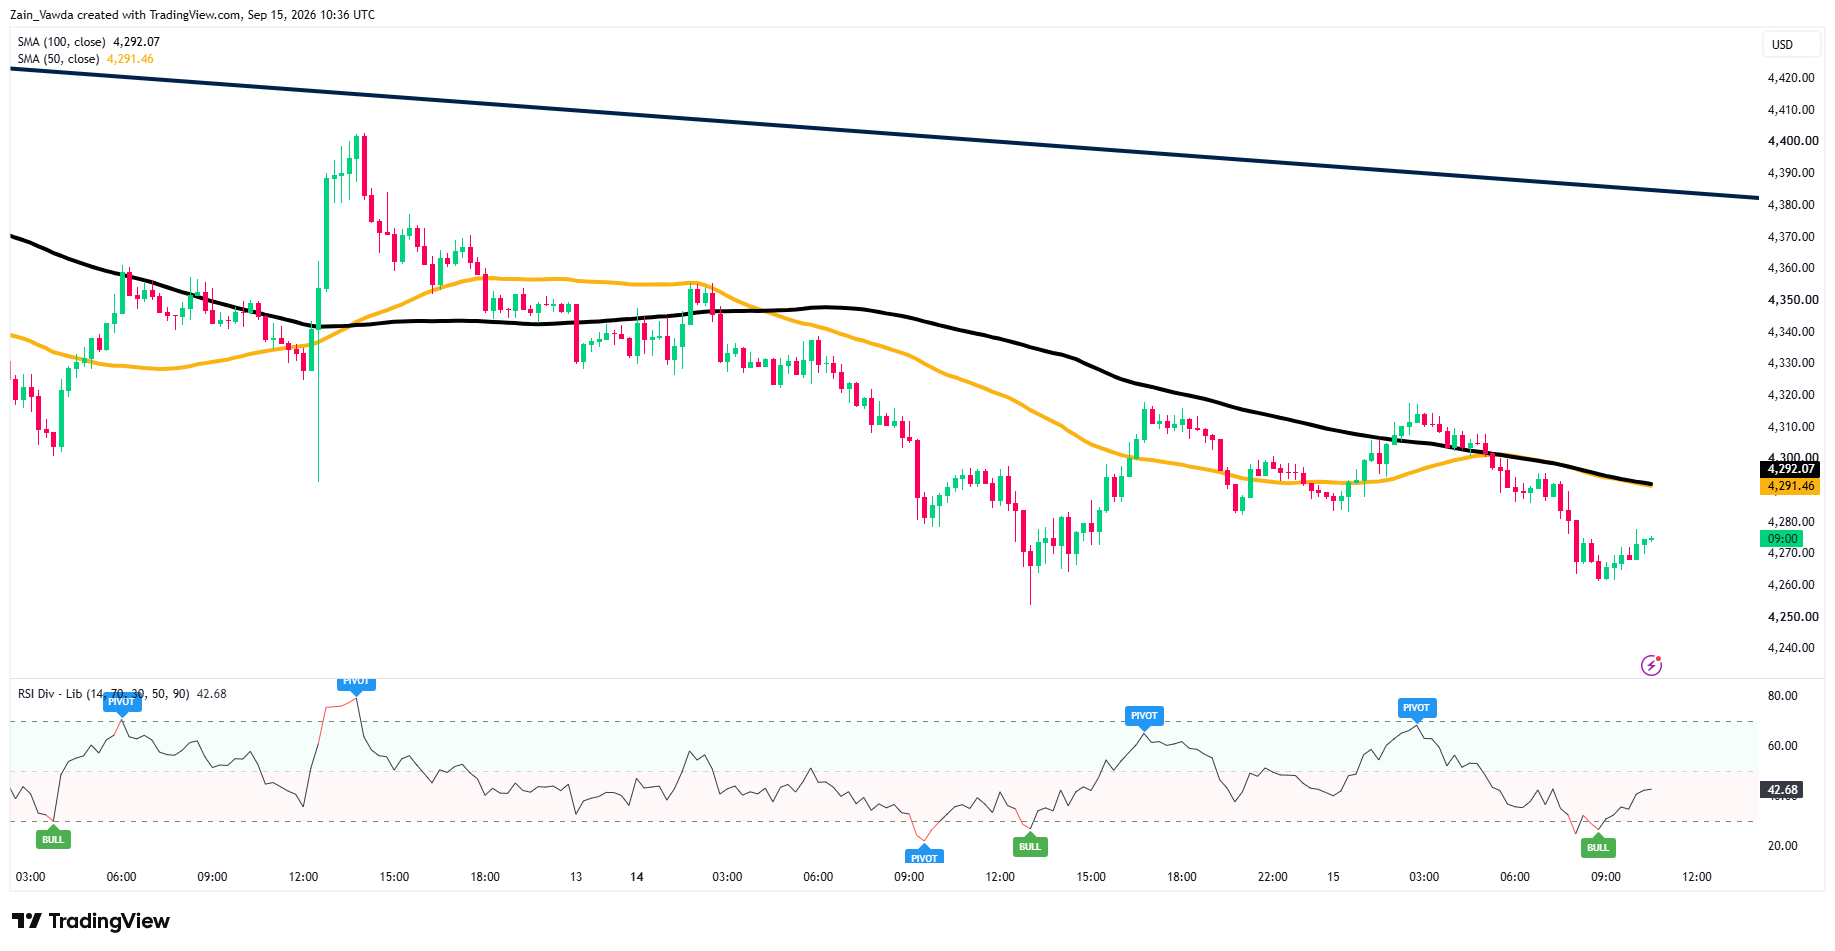
The short-term chart is where the tension sits. Price has bounced off the $4,250 area, and the 50- and 100-period moving averages have flattened and sit almost on top of each other at roughly $4,291–$4,292.
Gold M15 Chart, September 15, 2026
Source: TradingView
Price is pressed just underneath. That flat, twin-average cluster is the immediate decision point: reclaim it and hold, and the door opens toward the heavier resistance above; get rejected, and the recent low comes back into play.
The 15-minute RSI near 43 is recovering off its own bullish divergence low, so short-term momentum is trying to turn up.
The Level Map Into the Fed
Putting the three timeframes together gives a clean ladder.
Resistance: the first hurdle is the ~$4,290 cluster on the 15-minute. Above that, $4,318 (1-hour 50-MA), then the real test, the $4,348–$4,383 band where the 1-hour 100-MA, the daily 100-day average, the 4-hour 50-MA, and the descending trendlines all converge, with the $4,400 round number just beyond.
Until gold closes back above that band, rallies are more likely to be selling opportunities than trend changes.
Support: the line in the sand is $4,250–$4,263, today's low and last week's floor. Lose that on a closing basis and there is little obvious support until the $4,200 psychological level, with the air below it thin.
The setup: here is the nuance. The trend is down, yet momentum is stretched and divergent on all three timeframes at the same time, right as the market has already priced a hike at roughly 85–90% odds.
When so much bad news is in the price, an outcome that is merely as expected, rather than even more hawkish, can trigger a "sell the rumour, buy the fact" bounce. The bullish divergences are quietly flagging that risk. A relief pop into the $4,290–$4,318 zone would fit that script, but it stays a fade unless the Fed genuinely surprises on the dovish side.
For today's U.S. session, then: expect chop and drift rather than a decisive break, with the $4,250 floor and the $4,290 cluster as the near-term goalposts. The bigger move waits for Wednesday.
Looking for an Edge
Looking at trader positioning data provided by the MarketFramework Positioning Edge Tool, profitable and unprofitable traders each hold about 42% long positions on Gold (MGC), meaning roughly 58% are short.
When the two crowds line up like this, positioning gives little contrarian signal; there's no clear "wrong-way" group to fade. What separates them is results, not direction.
Same bias, opposite outcomes, a reminder that entry timing, risk management and exits matter more than simply picking a side. With both cohorts tilted short into the Fed decision, the broad lean sits with gold sellers for now.


