
After slipping below $64 and losing the first support zone identified in the previous MarketFramework analysis, silver is now approaching the $60-$62 area, putting $61 at the center of the next test for bulls.
The move extends a decline from the $67-$68 resistance zone, where silver had struggled to sustain its latest advance. The question now is whether the $60-$62 region can absorb the selling pressure or whether the metal’s correction has further to run.
From $64 support to the $61 test
The white metal’s break below $64 therefore matters because it has shifted the market from a relatively contained consolidation to a test of deeper support. $61 is roughly the midpoint of the $60-$62 zone, making the level an important reference for traders assessing whether buyers are prepared to step back in.
A sustained hold above the $60-$62 zone would keep the broader bullish structure from breaking down completely. A decisive move below $60, however, would raise the risk of a deeper retracement and bring lower support levels back into focus.
Fed repricing adds to the pressure
The technical deterioration is occurring alongside a more difficult macro backdrop for precious metals.
Renewed expectations for another Federal Reserve rate hike have pushed Treasury yields higher, while the dollar has strengthened. Both developments increase the pressure on non-yielding metals such as silver.
The Fed’s Sept. 16 rate hike already moved policy into a 3.75%-4.00% target range. Subsequent concerns over inflation, particularly from higher energy prices, have kept the possibility of additional tightening in focus.
That creates a difficult combination for silver: higher real yields reduce the appeal of holding the metal, while dollar strength adds another headwind to dollar-denominated commodities.
Silver faces a bigger hurdle than gold
Silver’s weakness also highlights its greater sensitivity to the economic cycle.
Unlike gold, silver has substantial industrial demand, meaning the metal can be pressured not only by higher rates and a stronger dollar but also by concerns that tighter financial conditions could weigh on global manufacturing and industrial activity.
That helps explain why silver can fall more aggressively than gold during periods of rising yields.
While silver fell nearly 5% by mid New York session on Monday, gold also moved southward, albeit by a more modest 3.6%, and is sitting at a key technical level around $4,150.
Positioning Stays Bullish, but Crowding Raises the Stakes at $61
CFTC’s Commitment of Traders (COT) report for the week ended Sept. 22 shows managed funds are net bullish on Silver futures (SI). Funds hold about 3.2 longs for every short. But longs and shorts were trimmed by similar amounts, which appears like position-squaring and reduced risk-taking, rather than fresh bearish bets, or a rush to exit.
MarketFramework’s Top Traded Contracts tool shows E-mini Silver futures (SIL) positioning remains firmly bullish. The 7-day lean is Strong Long, while on Monday, 67% of traders are long versus 33% short. The winner/loser split is also notable: 66% of winning traders are long, compared with 67% of losing traders who are also long. That suggests the bullish crowd remains heavily committed, but the trade is becoming increasingly crowded on both sides of the performance distribution.
Silver’s $61.36 Support Faces a Decisive Technical Test
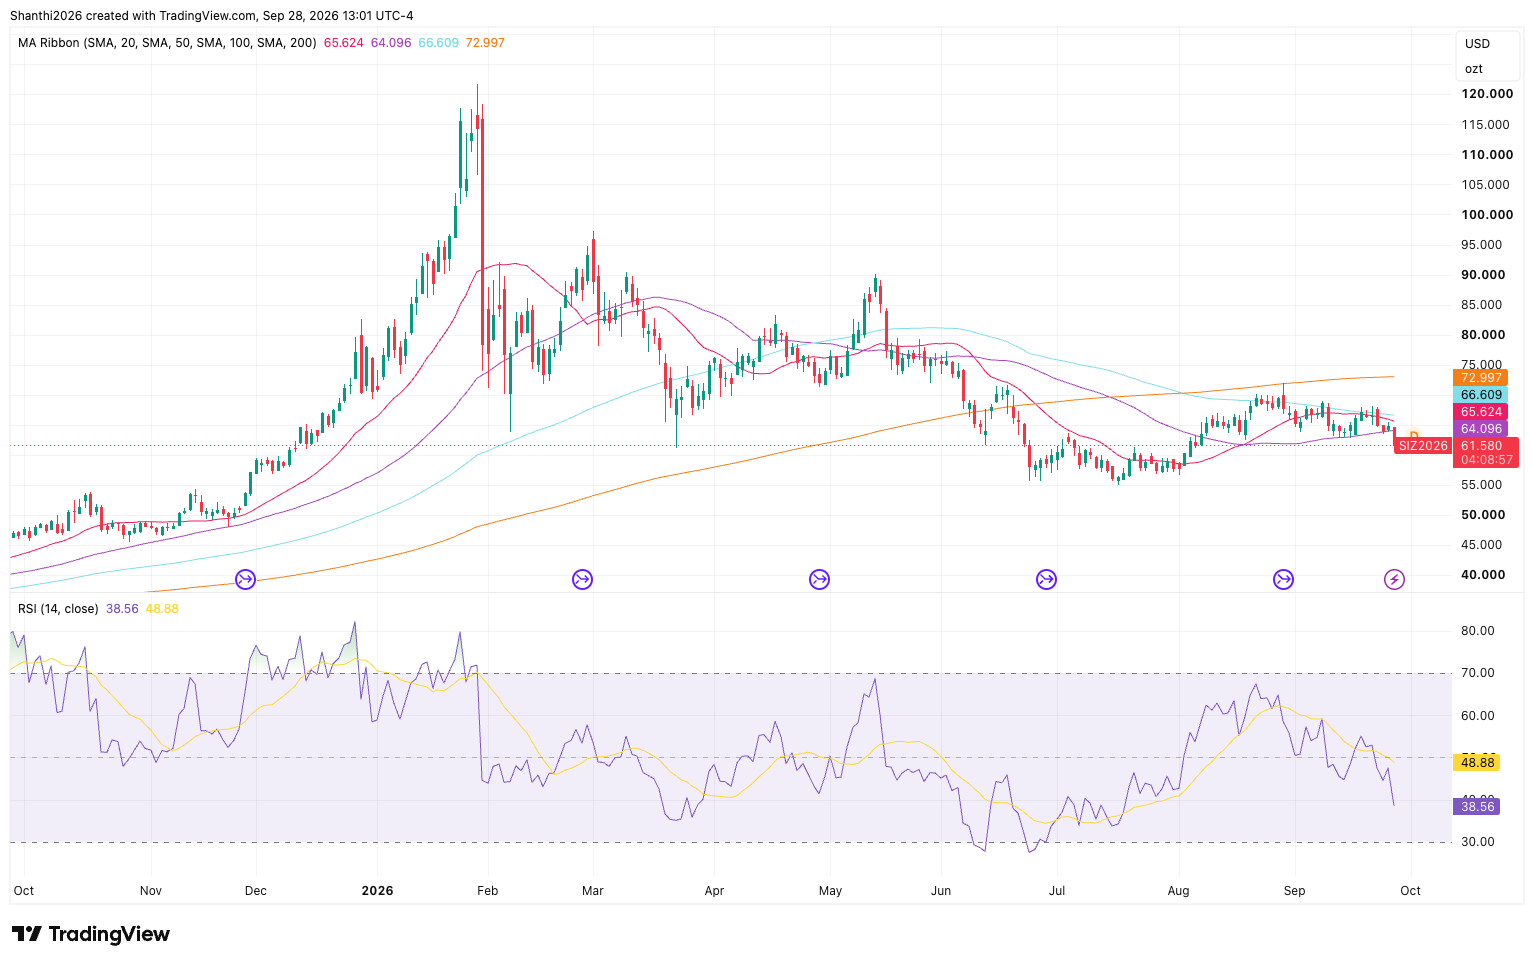
The SI contract is at a critical juncture near $61.36-$61.60, consolidating directly above major horizontal support following a sharp, multi-month corrective trend from the early 2026 peak near 120. Across daily price charts, the price action is stacked beneath every primary moving average, specifically the 20-day SMA (65.62), 50-day SMA (64.10), 100-day SMA (66.61), and 200-day SMA (72.997). Daily momentum indicators further reinforce this underlying distribution, as the daily RSI sits at 38.56, sloping downward toward oversold territory without yet reaching a definitive cap, thereby allowing technical scope for further downside expansion.
Source: TradingView
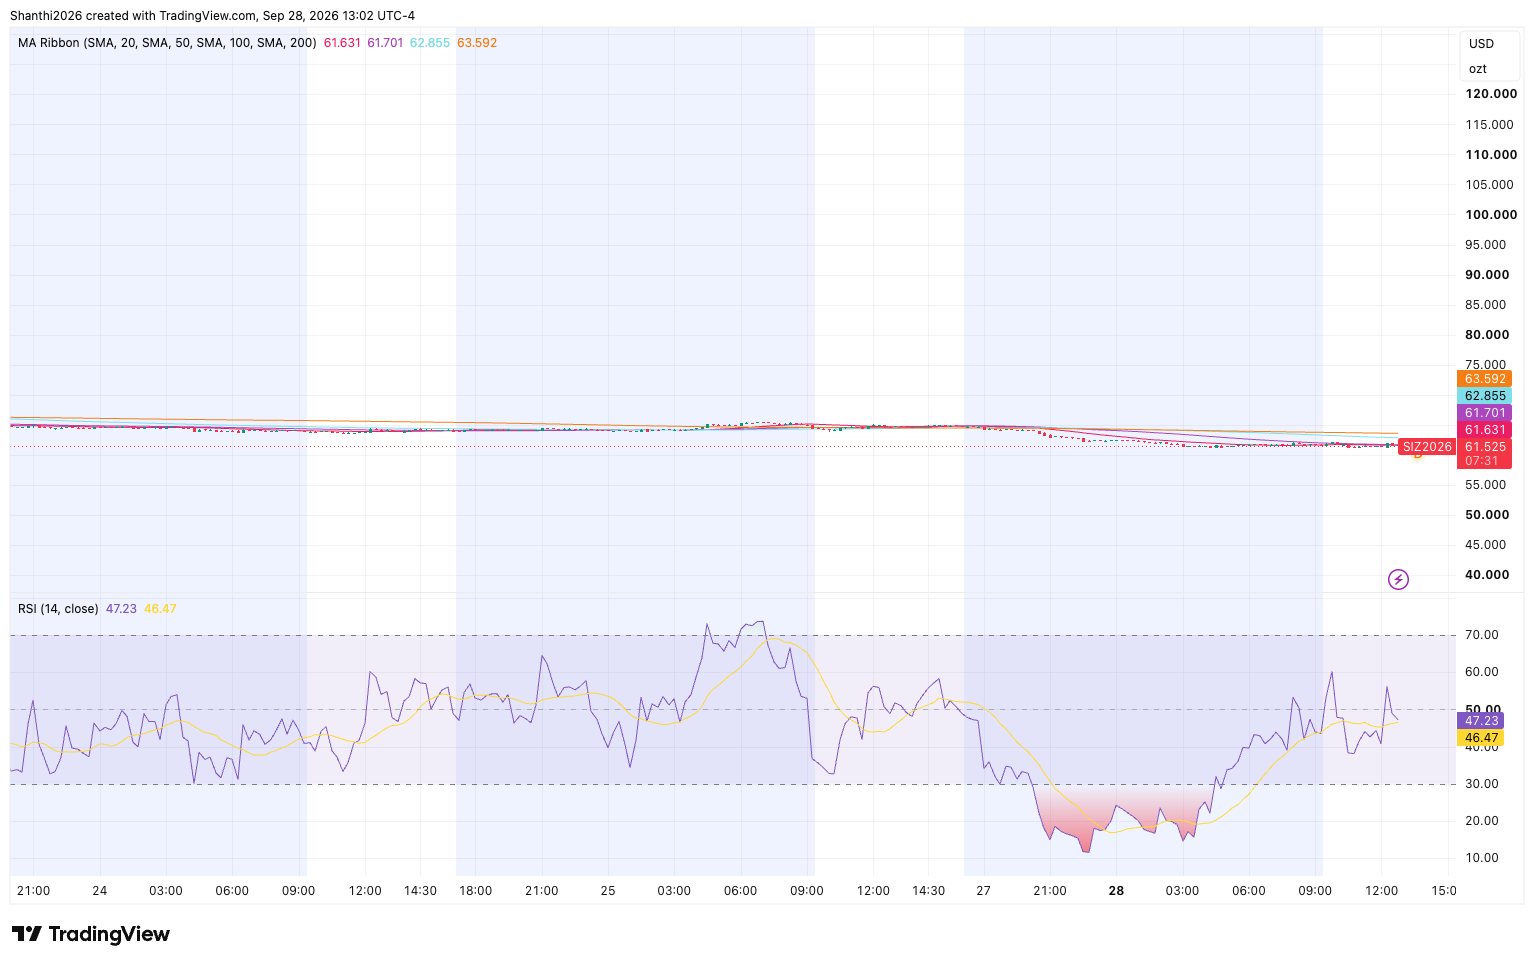
Intermediate and shorter timeframes reflect an active volatility contraction as buyers defend the long-term support floor. On the 1-hour chart, price remains capped beneath a fanning cluster of short-term moving averages spanning 61.63-62.85, though the 1-hour RSI has managed a modest recovery to 47.23 after hitting oversold conditions sub-30. Meanwhile, 15-minute price action reveals tight, range-bound compression between 61.36 and 61.70.
Source: TradingView
Trading strategies revolve around two distinct structural triggers surrounding the 61.36 support pivot. A confirmed breakdown with a daily or 1-hour candle body close below 61.36 opens a high-probability continuation path toward intermediate targets at 58.25 and the key 55.00-56.00 demand zone. Conversely, a counter-trend relief rally requires 15-minute or 1-hour displacement back above 62.85, opening upside targets toward the 50-day SMA at 64.10 and the 20-day/100-day SMA cluster near 65.62.
$61 becomes the line to watch
The key question is no longer whether silver can reclaim $64 immediately. It is whether buyers defend $60-$62 strongly enough to prevent the correction from becoming a broader trend reversal.
For now, $61 is the market’s next line in the sand as Fed-hike expectations, higher yields and dollar strength test the bullish silver trade.