
Market Sentiment Ahead of the Open
U.S. stock futures are in the red ahead of Monday's open. Over the weekend, President Trump rejected Iran's proposal to reopen the Strait of Hormuz and end the fighting. Oil jumped in response, with Brent above $108 a barrel, and Treasury yields rose with it.
The 10-year yield is near 5.23%, and markets now see about a 70% chance of another Fed rate hike on October 28.
The Dow is holding up better than the rest of the market. Dow futures were down about 0.4% early in the session, compared with roughly 1% for Nasdaq 100 futures. That is because the Dow has less exposure to the tech stocks leading the selling, and it includes energy names like Chevron that tend to benefit when oil rises.
This follows Friday, when the Dow rose 0.9% to 51,829, snapping a three-day losing streak.
Monday's U.S. data is light, with the Dallas Fed manufacturing survey and Fed speakers on the calendar. The bigger tests come later in the week with PCE inflation on Wednesday and the jobs report on Friday.
H4 Chart: The Bigger Trend Still Points Down
Dow Jones (YM) Four-Hour Chart, September 28, 2026
Source: TradingView
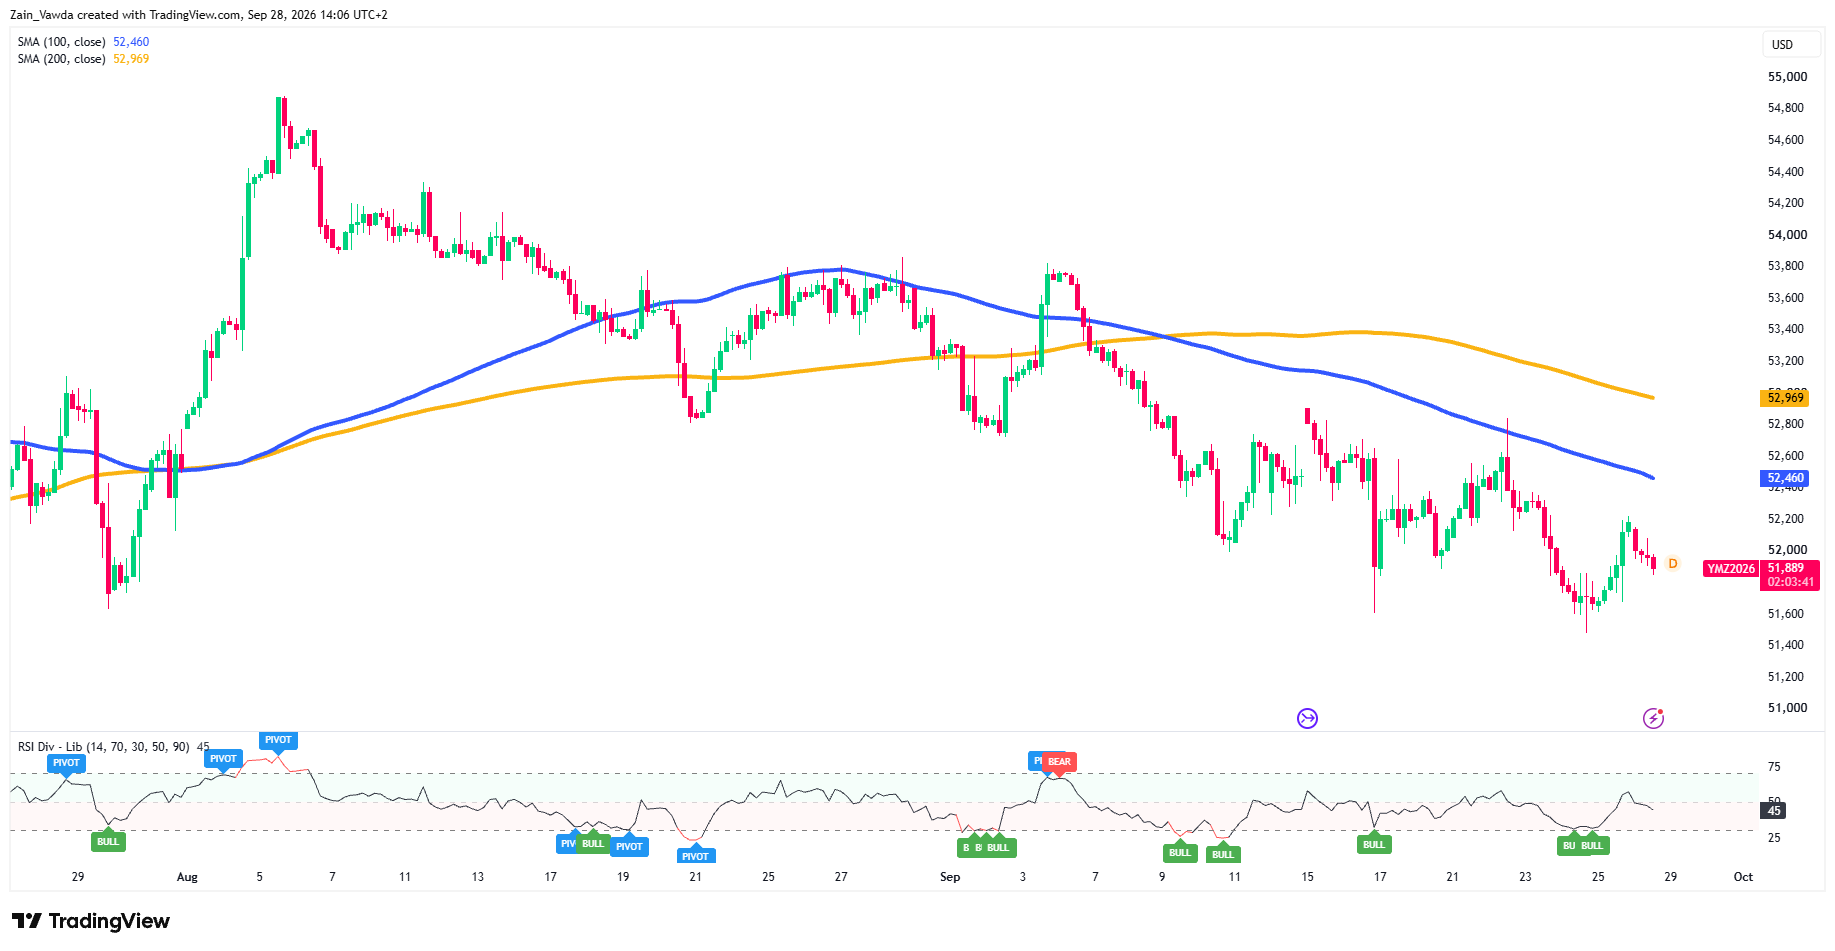
Since peaking near 54,900 in early August, YM has made a series of lower highs, around 53,800, then 52,900, then 52,700. In early September the 100-period moving average crossed below the 200-period average, a signal traders call a “death cross” that confirms the trend has turned lower.
Price sits at 51,889, well below both lines at 52,460 and 52,969.
There is one positive. When price made a new low near 51,500 last week, RSI (a 0-to-100 momentum gauge) made a higher low. This bullish divergence shows selling pressure was fading, and it helped spark Friday's bounce. But that bounce has stalled well short of the 100-period average.
H1 Chart: Friday's Bounce Ran Into a Wall
Dow Jones (YM) One-Hour Chart, September 28, 2026
Source: TradingView
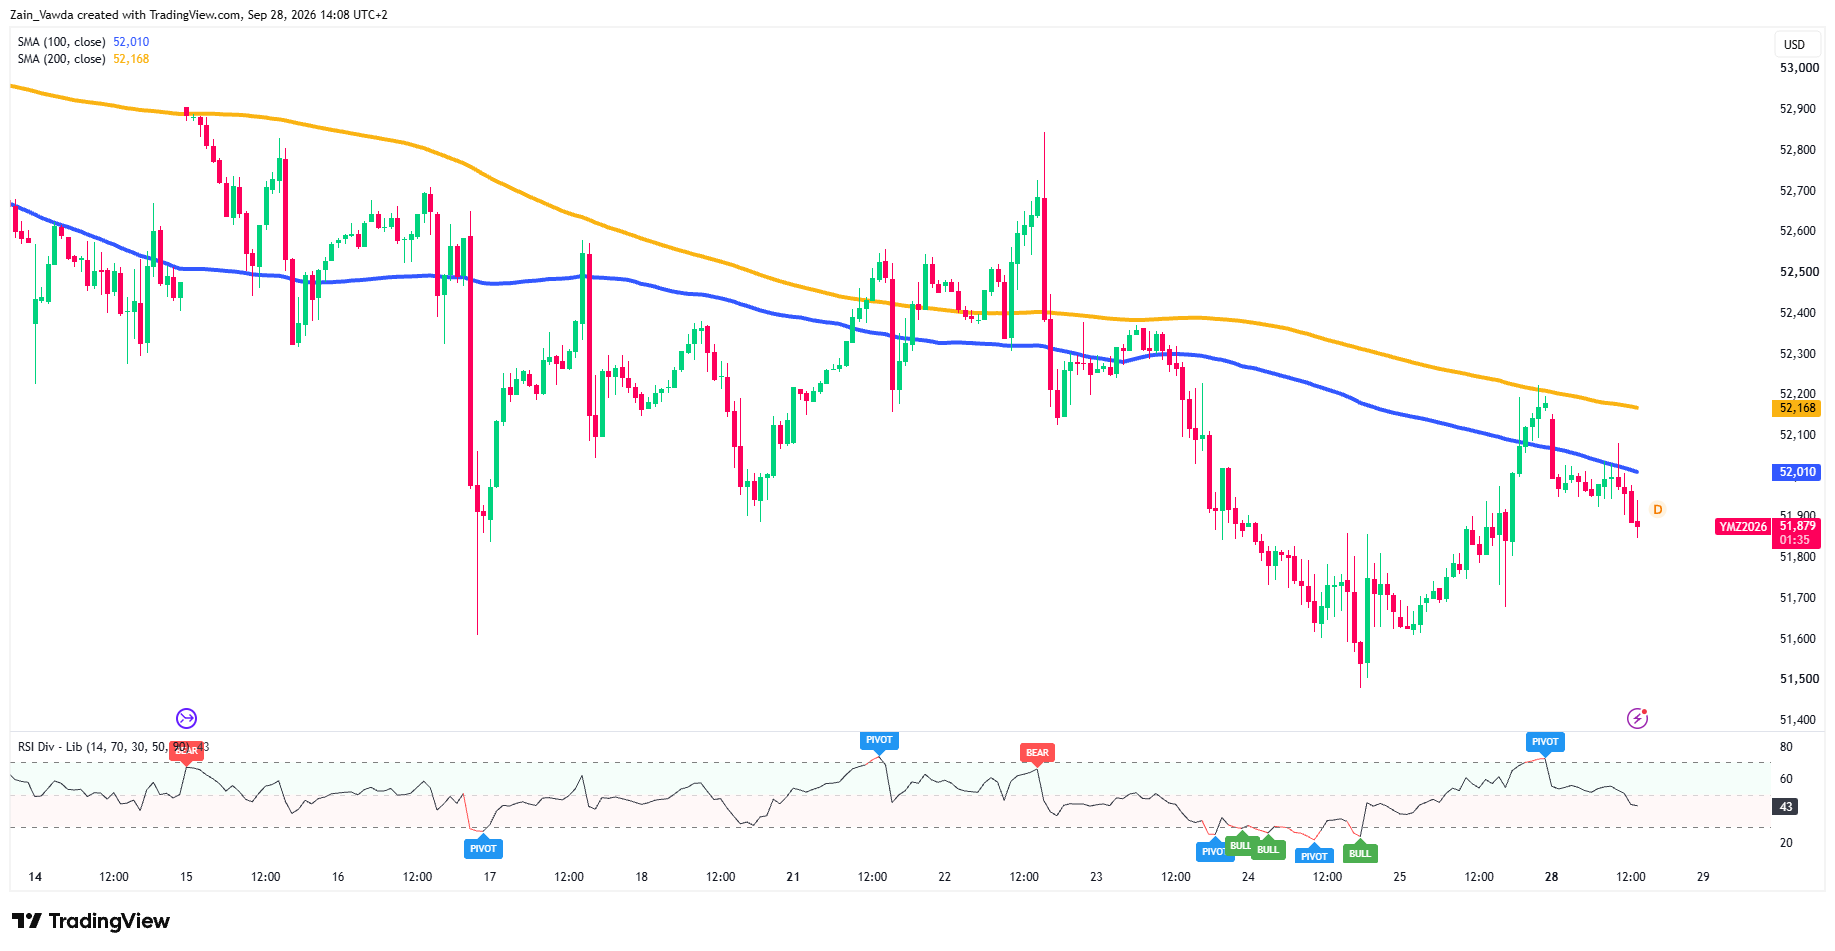
The one-hour chart shows exactly where the bounce ran out. YM rallied from 51,500 to about 52,220, tagging the 200-period average (now 52,168) almost to the point before sellers stepped in.
RSI also turned down from near 70, the level that usually means a market has risen too far, too fast.
Price has since slipped back below the 100-period average at 52,010, and RSI is at 43, under the 50 midline.
In simple terms, the short-term trend is back in the sellers' hands. While price stays below the 52,010 to 52,200 zone, rallies look more like selling chances than a new uptrend.
M15 Chart: Pinned to the Last Line of Support
Dow Jones (YM) M15 Chart, September 28, 2026
Source: TradingView
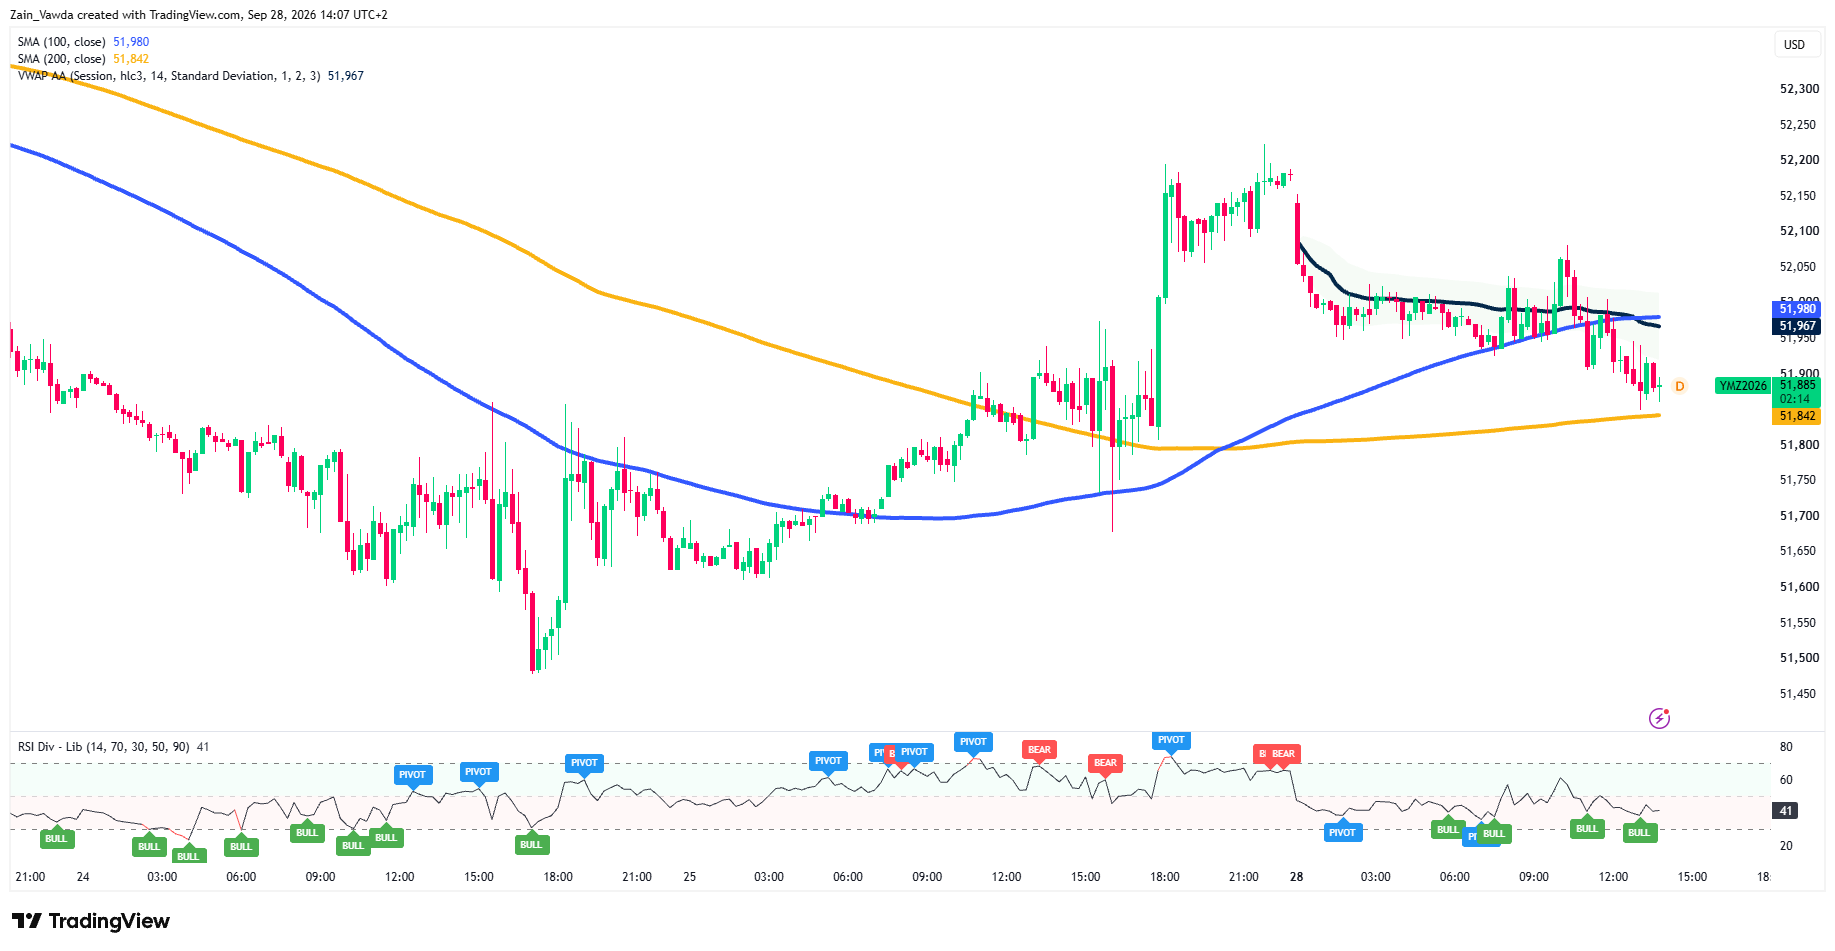
YM gapped lower at the Sunday open and has drifted down since. It trades below the session VWAP (the volume-weighted average price) at 51,967 and the 100-period average at 51,980, and a mid-morning push toward 52,070 was sold.
Price now sits just above the 200-period average at 51,842, the last short-term support before 51,800.
RSI at 41 has flashed small bullish divergence signals near the lows, so a quick bounce is possible. But a bounce that fails below 51,970 to 52,010 would keep sellers in control.
Scenarios Into the US Open and Dallas Fed Survey
| Scenario | What Needs to Happen | Targets | What Cancels It |
|---|---|---|---|
| Bull | Oil eases and yields cool; YM holds 51,800 and closes an hour above 52,010 | 52,200, then 52,460 | A drop back under 51,970 |
| Base | Oil stays high with no new escalation; traders wait for Wednesday's PCE | Choppy range between 51,800 and 52,010 | A clean hourly close outside the range |
| Bear | Oil pushes higher and yields hit new highs; YM breaks and holds below 51,800 | 51,700, then 51,500 | A reclaim of 52,010 |
The Bottom Line
The Dow is showing relative strength against the Nasdaq today, but its own chart has not turned.
The trend on H4 is down, the H1 bounce was rejected at the 200-period average, and M15 is sitting on its last support. Bulls need a reclaim of 52,010 to change the tone.
Until then, 51,800 is the level that decides whether Monday is a pause or the start of the next leg lower.