Gold’s slide has continued on Thursday. Spot gold (XAU/USD) touched a low near $4,244 and is trading around $4,262 in the US session, down close to 1% on the day. In Wednesday’s update, we warned that gold had lost the bottom of its $4,320–$4,400 range and that the breakout buffer was getting thin. Today, that buffer has almost run out.
Why Gold Keeps Falling
The story is the same, just louder. The 10-year Treasury yield has climbed to around 5.13%, its highest level since May 2007.
Wednesday’s strong PMI data showed prices rising at their fastest pace in years, a weak Treasury auction added to the bond selling, and today’s jobless claims stayed low. A solid job market gives the Fed room to keep raising rates.
At the same time, the U.S. Dollar Index is holding above 101 and oil has bounced back above $93, keeping inflation worries alive.
Gold pays no interest, so every rise in yields makes it harder to hold. Gold is now down roughly 8.7% over the past month.
Four-Hour Chart: The Wedge Floor Is in Sight
Gold Four-Hour Chart, September 24, 2026
Source: TradingView
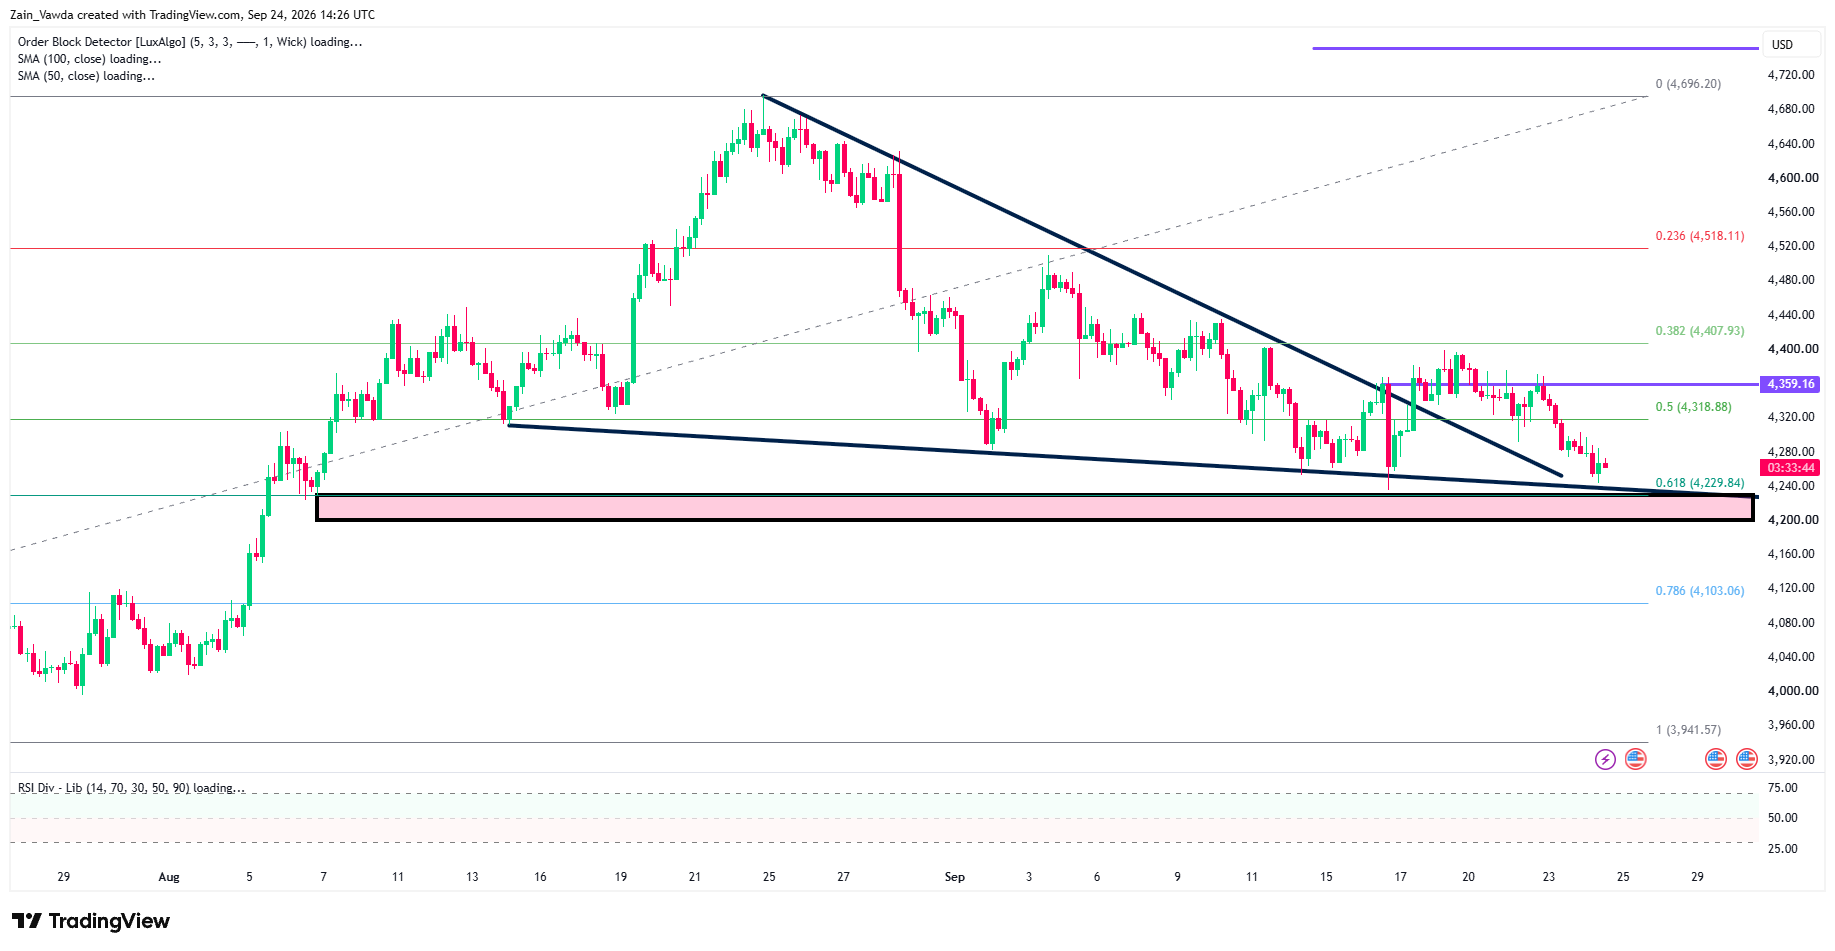
The four-hour (H4) chart shows the falling wedge that has shaped gold since the August 24 peak at $4,696. Price broke above the upper line on September 17, but that breakout has now faded. Gold has fallen back below the $4,359 level and the 50% Fibonacci retracement at $4,319.
Price is now closing in on a strong support cluster. The lower wedge line, the 61.8% Fibonacci level at $4,230 and a demand zone between $4,200 and $4,230 all sit in the same area.
This is where buyers have stepped in before, most recently on September 16.
One-Hour Chart: Rallies Keep Getting Sold
Gold One-Hour Chart, September 24, 2026
Source: TradingView
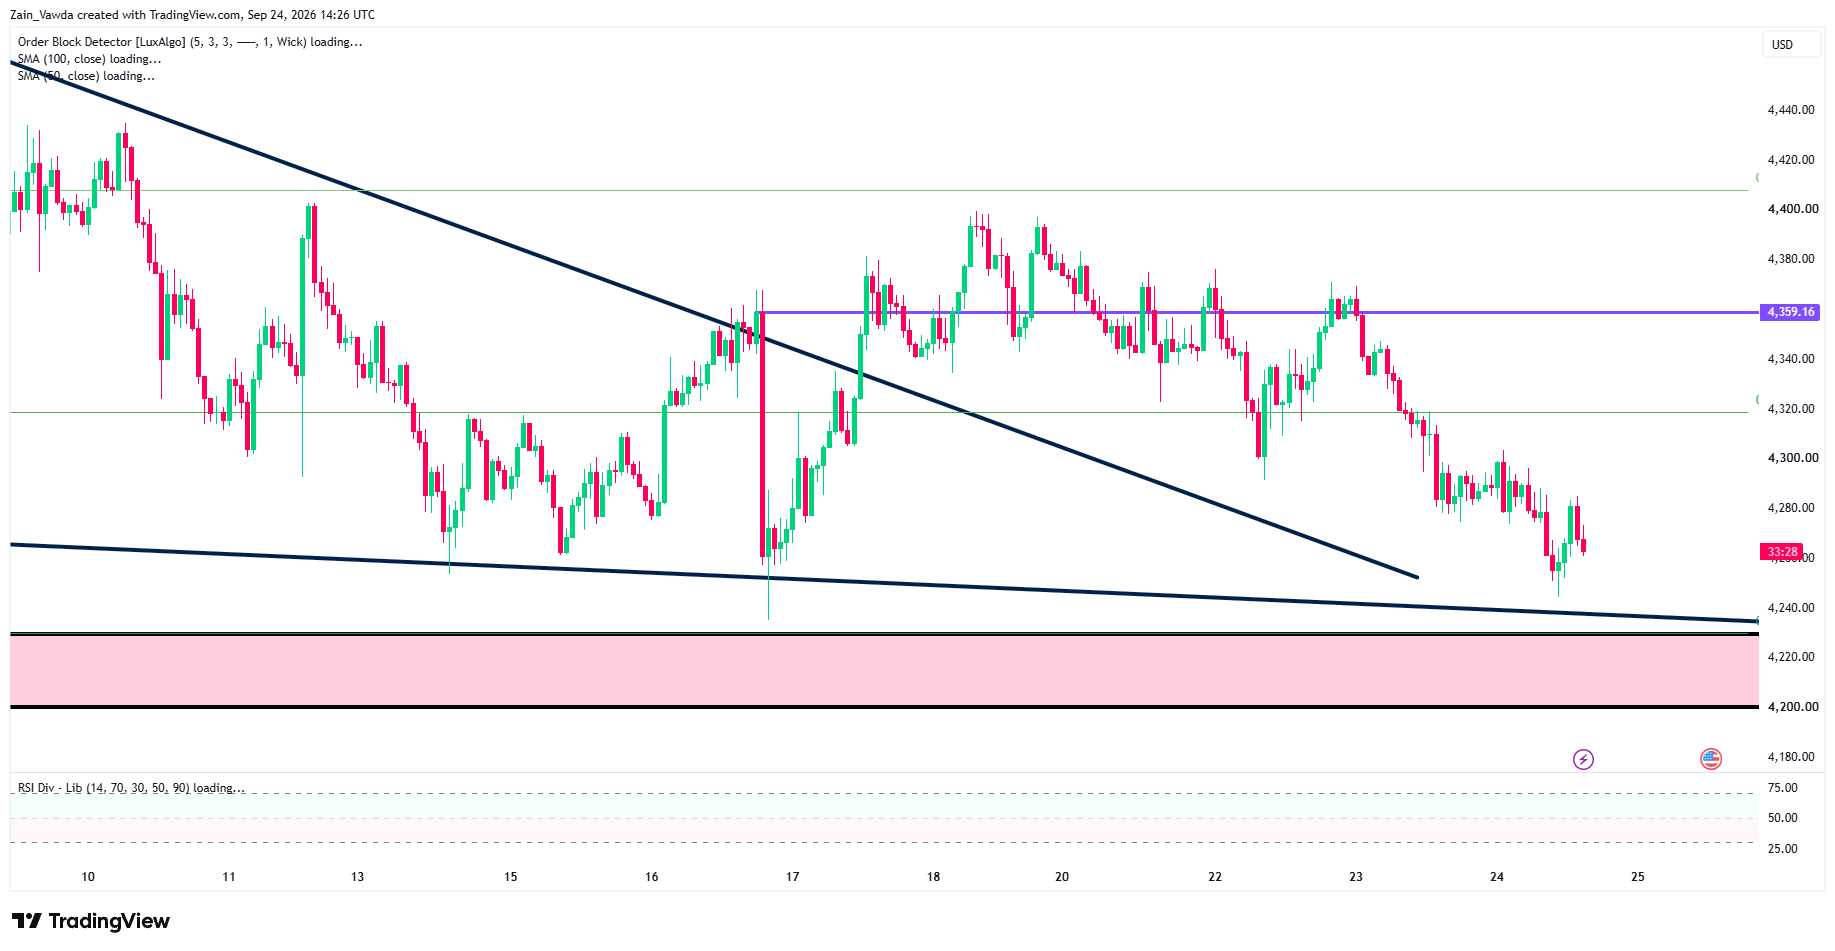
The one-hour (H1) chart makes the bearish shift clear. Since the September 18 high near $4,400, every bounce has stalled at a lower level: first $4,380, then $4,370, then $4,300 and today about $4,285.
That pattern of lower highs is the clearest sign sellers maybe in charge.
15-Minute Chart: Today's Bounce Already Fading
Gold M15 Chart, September 24, 2026
Source: TradingView
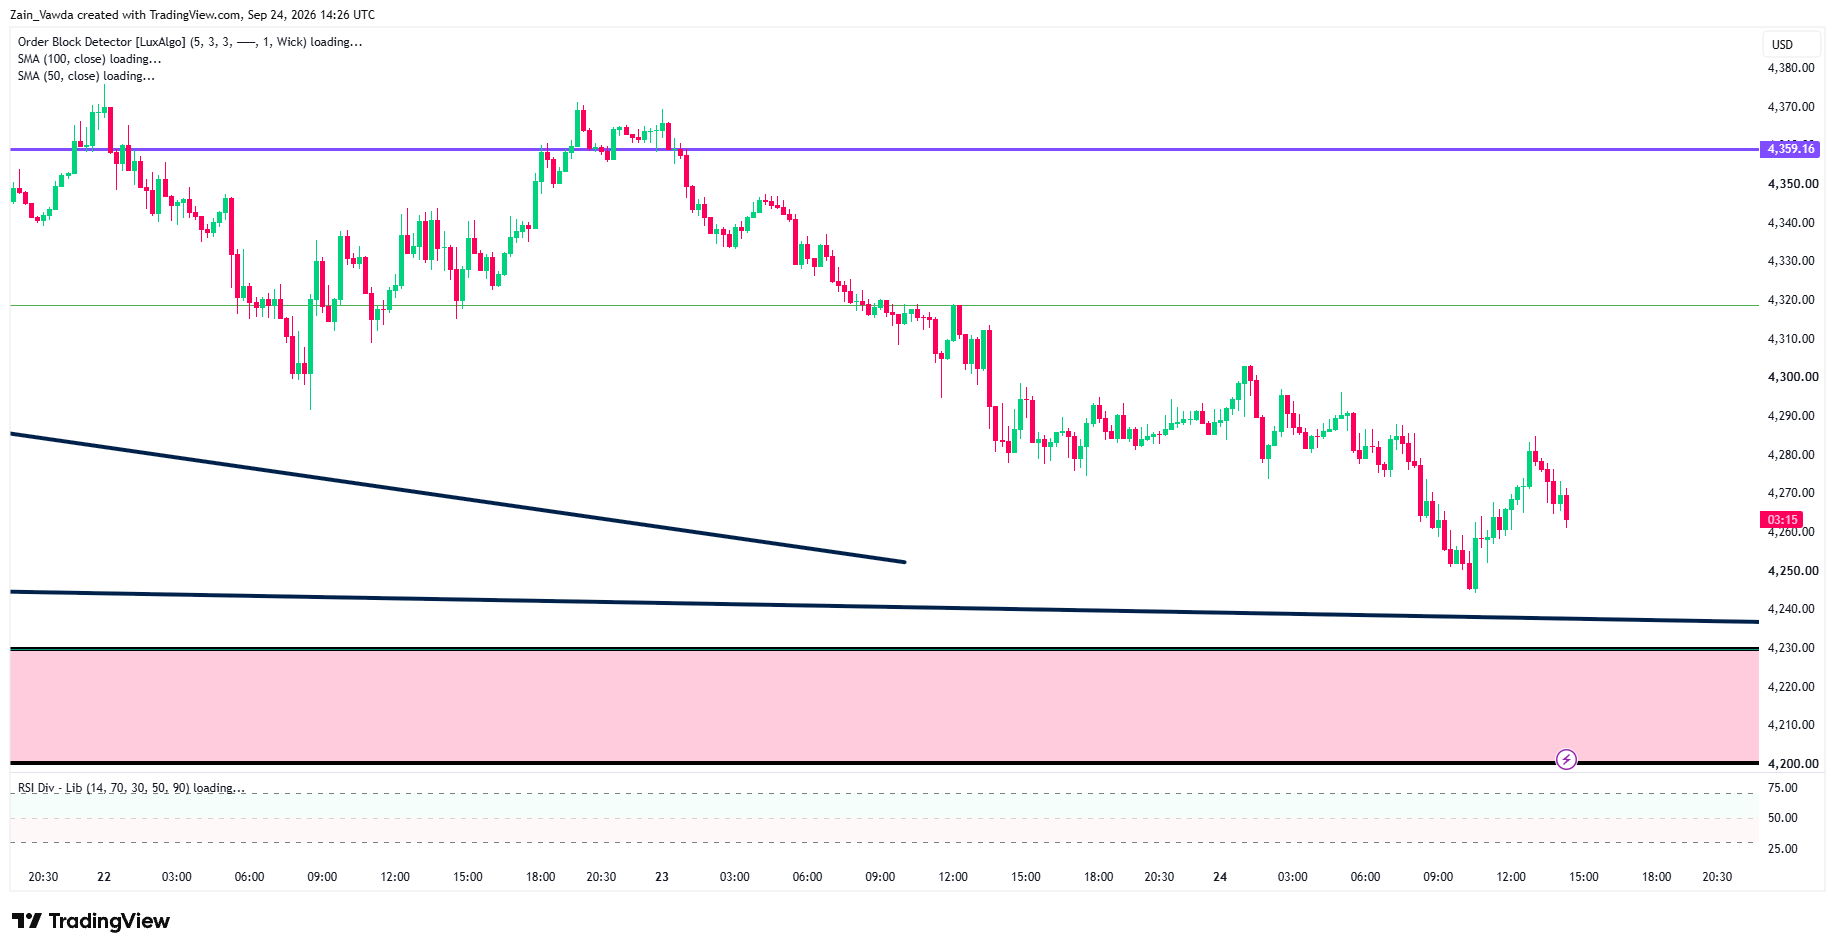
On the 15-minute (M15) chart, gold bounced from the $4,244 low to around $4,285, but sellers returned quickly. Price is slipping back toward $4,260.
A break below today’s low would put the wedge floor near $4,238 straight in play.
So, Have Bears Taken Control?
In the short term, yes. Lower highs on the H1 and M15 charts and the failed breakout on the H4 all point the same way. But bears have not yet broken the level that matters most.
As long as gold holds above $4,200, the wedge is still intact and a rebound remains possible, especially if yields cool.
Potential Scenario Matrix
| Scenario | Trigger | Gold Implications |
|---|---|---|
| Bull | Yields pull back from 2007 highs, DXY slips below 101 | Bounce from $4,230–$4,240 back to $4,285, then $4,300–$4,319 |
| Base | Yields steady, no major headline | Grinds lower to test $4,230–$4,240, holds for now |
| Bear | 10-year pushes above 5.15%, dollar extends gains | Daily close below $4,200 opens $4,103 |
For the Trader
Marketframework Positioning Edge Tool data is showing an extreme bullish divergence.
As the 4-hour session unfolded, profitable traders steadily accumulated long exposure up to 78%, while unprofitable traders aggressively took short positions down to 22% long.
This widening positioning gap demonstrates disciplined accounts accumulating near support while retail traders short into weakness, signaling strong underlying bullish momentum.