Spot gold (XAU/USD) is down about 1% on Wednesday, trading near $4,315 ahead of the U.S. session. On Monday, our base case was that gold would chop between $4,320 and $4,400 until a big headline or data point forced a break.
Price has now slipped below the bottom of that range, and the U.S. dollar is the main reason.
The good news for bulls: the triangle breakout we discussed on Monday has not failed yet. The bad news: the buffer is getting thinner, and the next 24 hours bring several events that could decide it.
Why Gold Is Under Pressure
The Federal Reserve raised rates by 0.25% last week, taking its main rate to 3.75%–4.00%, and its projections point to one more hike this year. Fed speakers keep leaning hawkish. On Tuesday, Richmond Fed President Thomas Barkin said the economy looks to be firming and that price shocks from tariffs and energy are not fading. That follows Austan Goolsbee’s similar warning on Monday.
Higher rates make the dollar more attractive and push up bond yields. Gold pays no interest, so it becomes harder to hold. The U.S. Dollar Index (DXY) is trading near 100.85, a two-month high, and the two-year Treasury yield is around 4.77%, close to levels last seen in 2024.
Here is the twist. Oil is falling. WTI crude is near $89.50, a two-week low, on hopes that U.S.-Iran talks at the United Nations are making progress. President Trump described a three-hour meeting with Iranian officials as very good.
Iranian state media reported that Foreign Minister Abbas Araghchi passed Tehran’s conditions for reopening the Strait of Hormuz to U.S. envoy Steve Witkoff, including lifting the U.S. naval blockade and releasing frozen assets. There is no breakthrough yet.
Normally, cheaper oil helps gold: less inflation means fewer rate hikes, which is the oil-inflation-rate pipeline we flagged on Monday. This week, that link is being overpowered by a Fed that is still talking tough.
The Chart: Breakout Still Holds, but the Range Floor Has Cracked
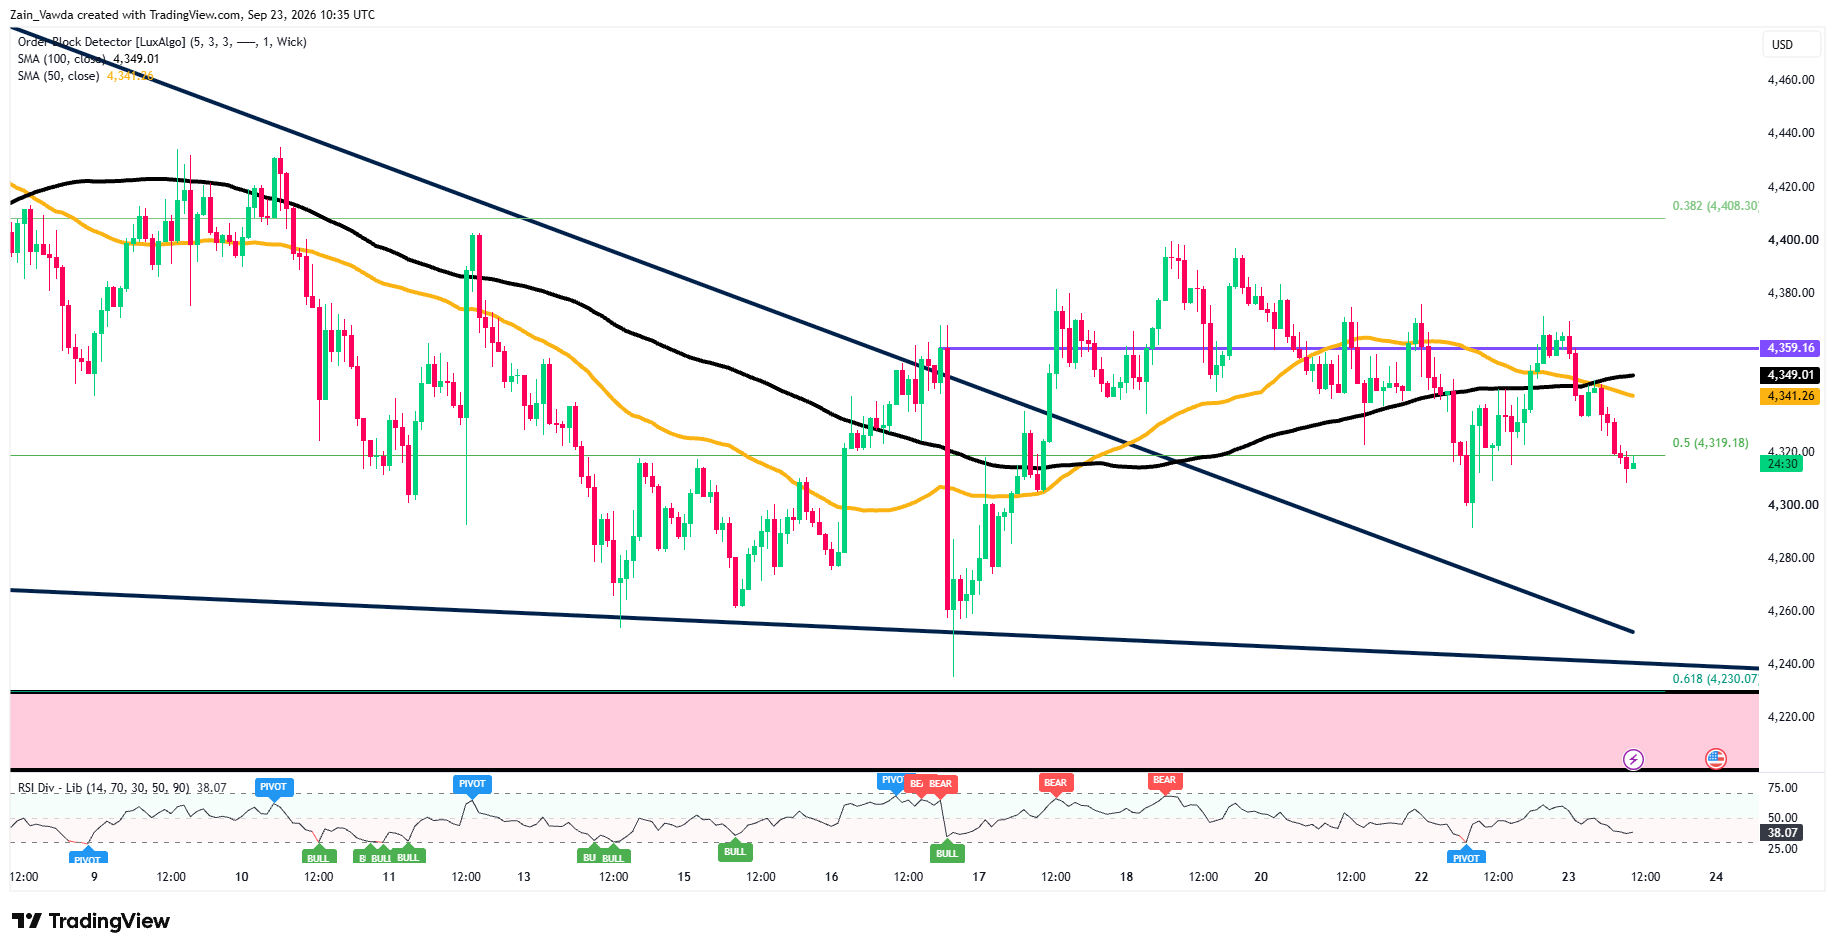
Gold One-Hour Chart, September 23, 2026
Source: TradingView
On the one-hour (H1) chart, gold has slipped back below the 50% Fibonacci level at $4,319 and trades under both its 50-hour and 100-hour moving averages ($4,341 and $4,349). The 50 has also rolled over below the 100, a sign that short-term momentum has turned lower. The $4,359 line has capped every bounce since last Thursday.
The breakout is still alive, though. The old descending triangle line now sits far lower, around $4,255–$4,265, and price is still well above it. Tuesday’s low near $4,290 is the first real line in the sand.
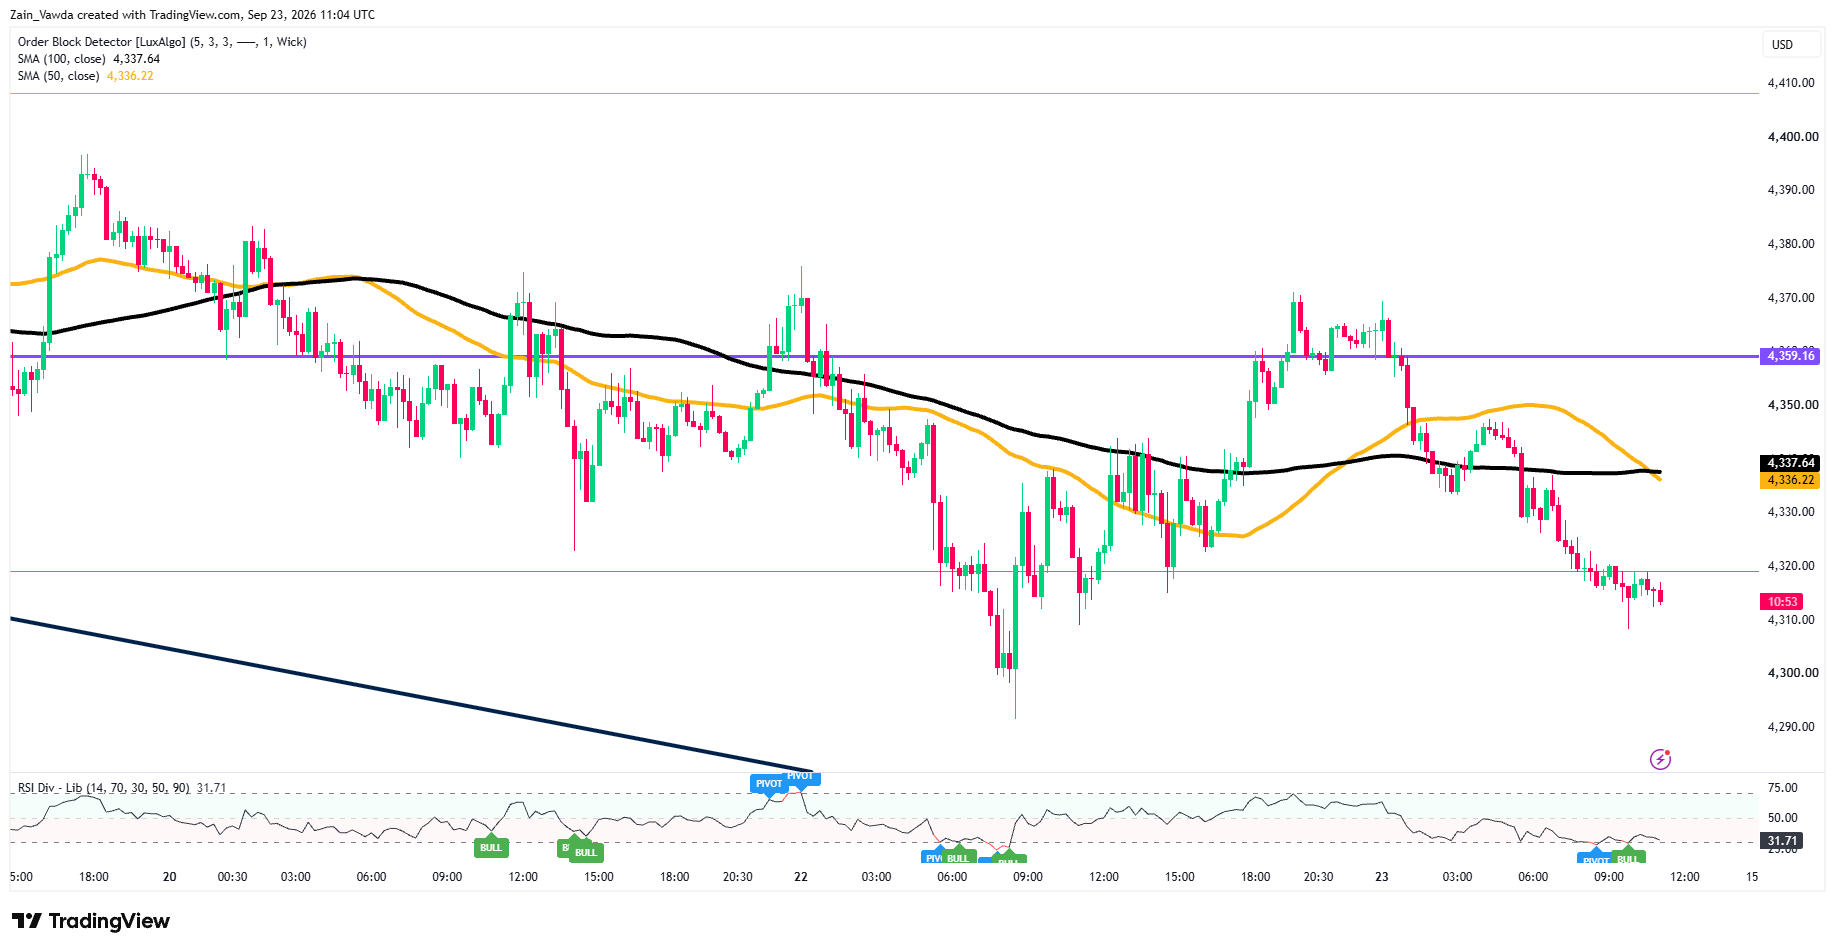
Gold 15-Minute Chart, September 23, 2026
Source: TradingView
The 15-minute (M15) chart shows a clean run of lower highs since Tuesday evening’s push to $4,370, with the 50 moving average crossing below the 100 near $4,337.
However, RSI is sitting near 32, close to oversold, and is flagging a bullish divergence.
In simple terms, sellers are getting tired, so a short bounce toward $4,336 before the next move would not be a surprise.
Outlook: US Session and Thursday
Today’s main event is the flash S&P Global PMI data for September, due at 9:45 a.m. ET. These surveys give an early read on business activity and are expected to show a resilient economy. A strong print would support more hikes and a firmer dollar. A soft one could give gold room to bounce.
Thursday is busier: weekly jobless claims at 8:30 a.m. ET (consensus around 203K versus 196K last week), new home sales, a $44 billion seven-year Treasury auction, remarks from New York Fed President John Williams, and the Trump–Xi meeting. Any Iran headline can land at any time.
Potential Scenario Matrix
| Scenario | Trigger | Gold Path |
|---|---|---|
| Bull | Soft PMIs or jobless claims, Iran progress, DXY slips back from 101 | H1 close above $4,320 opens $4,336, then $4,349–$4,359 |
| Base | Data roughly in line, no major headline | Choppy trade between $4,290 and $4,345 into Trump–Xi |
| Bear | Hot PMIs, DXY breaks 101, hawkish Williams | Break of $4,290 targets $4,255–$4,265, then $4,230 |
On Monday, MarketFramework’s Positioning Edge tool showed profitable traders leaning short: only 44% of profitable accounts were long, compared with 53% of unprofitable accounts. With gold now about $25 lower than it was then, that lean has been rewarded so far. Will history repeat itself today?