The US Dollar Index (DXY) is back above the line that matters. After two trips down to the 98.729 floor over the past month, the dollar has clawed its way back through the psychologically important 100.00 mark and is now knocking on 100.617.
Two forces are pushing in the same direction: a Federal Reserve that just hiked and wants to stay tight, and a Middle East that refuses to cool down.
Why the Dollar Is Bid: The Fed and Iran Point the Same Way
Two headlines on Tuesday told the same story.
First, the Fed. Boston Fed President Susan Collins said she backed last week’s rate hike and sees a “somewhat more restrictive” policy stance as the right way to pull inflation back to the 2% target. She also warned that the risks to inflation have grown while the jobs market looks a little sturdier, a mix that gives the Fed room to hold rates high for longer. In plain terms, a “restrictive” policy just means keeping interest rates high enough to slow the economy and cool prices.
For the dollar, higher-for-longer rates are simple fuel: they lift US yields and pull global money toward the greenback.
Second, Iran. Speaking at the UN General Assembly, President Trump urged the world to keep the economic squeeze on Tehran, “we must be united in maintaining pressure on Iran” and said he expects a deal only after the US elections.
He claimed more oil is now moving through the Strait of Hormuz than at any time since the war began, though US pump prices tell a different story, with gasoline near $4.47 a gallon and diesel at record highs.
The trade takeaway: the geopolitical risk premium in oil is not going away, which keeps inflation sticky and the Fed’s hawkish bias intact.
That is the desk’s recurring oil–dollar link in action. When oil stays firm, inflation stays hot, the Fed stays tight, and the dollar catches a bid through the rate channel.
Both of Tuesday’s headlines feed that same loop and the chart is starting to agree.
Daily: A Double Bottom Takes Shape
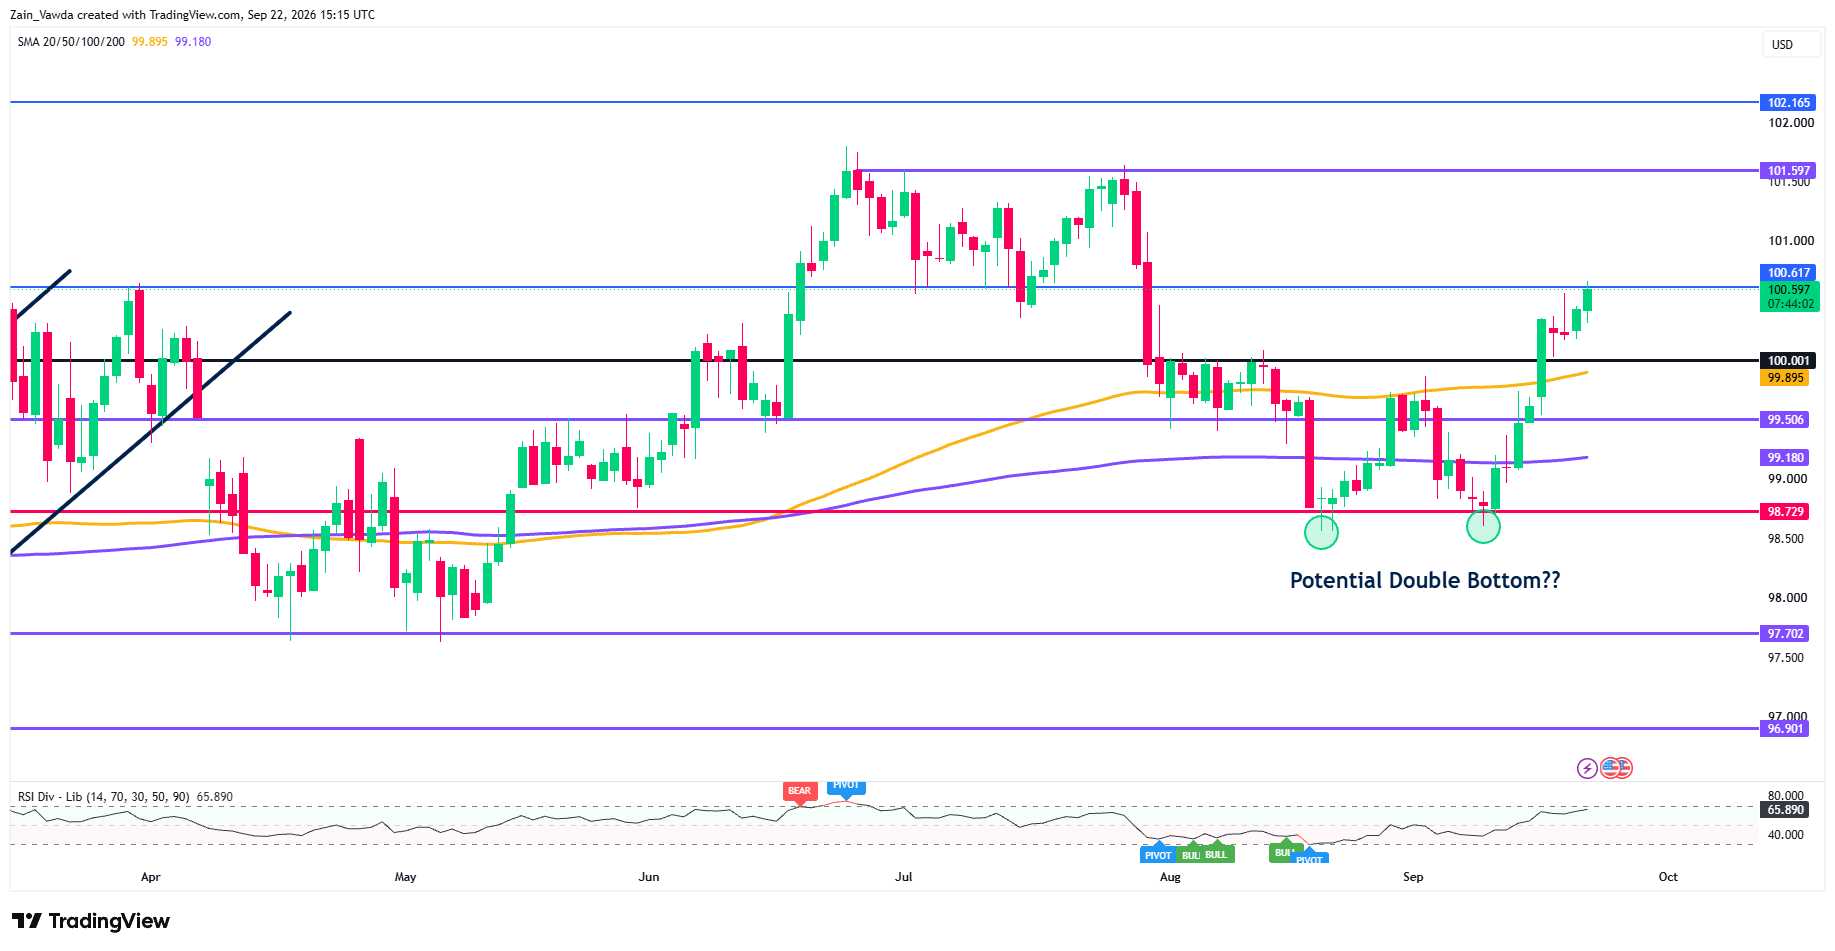
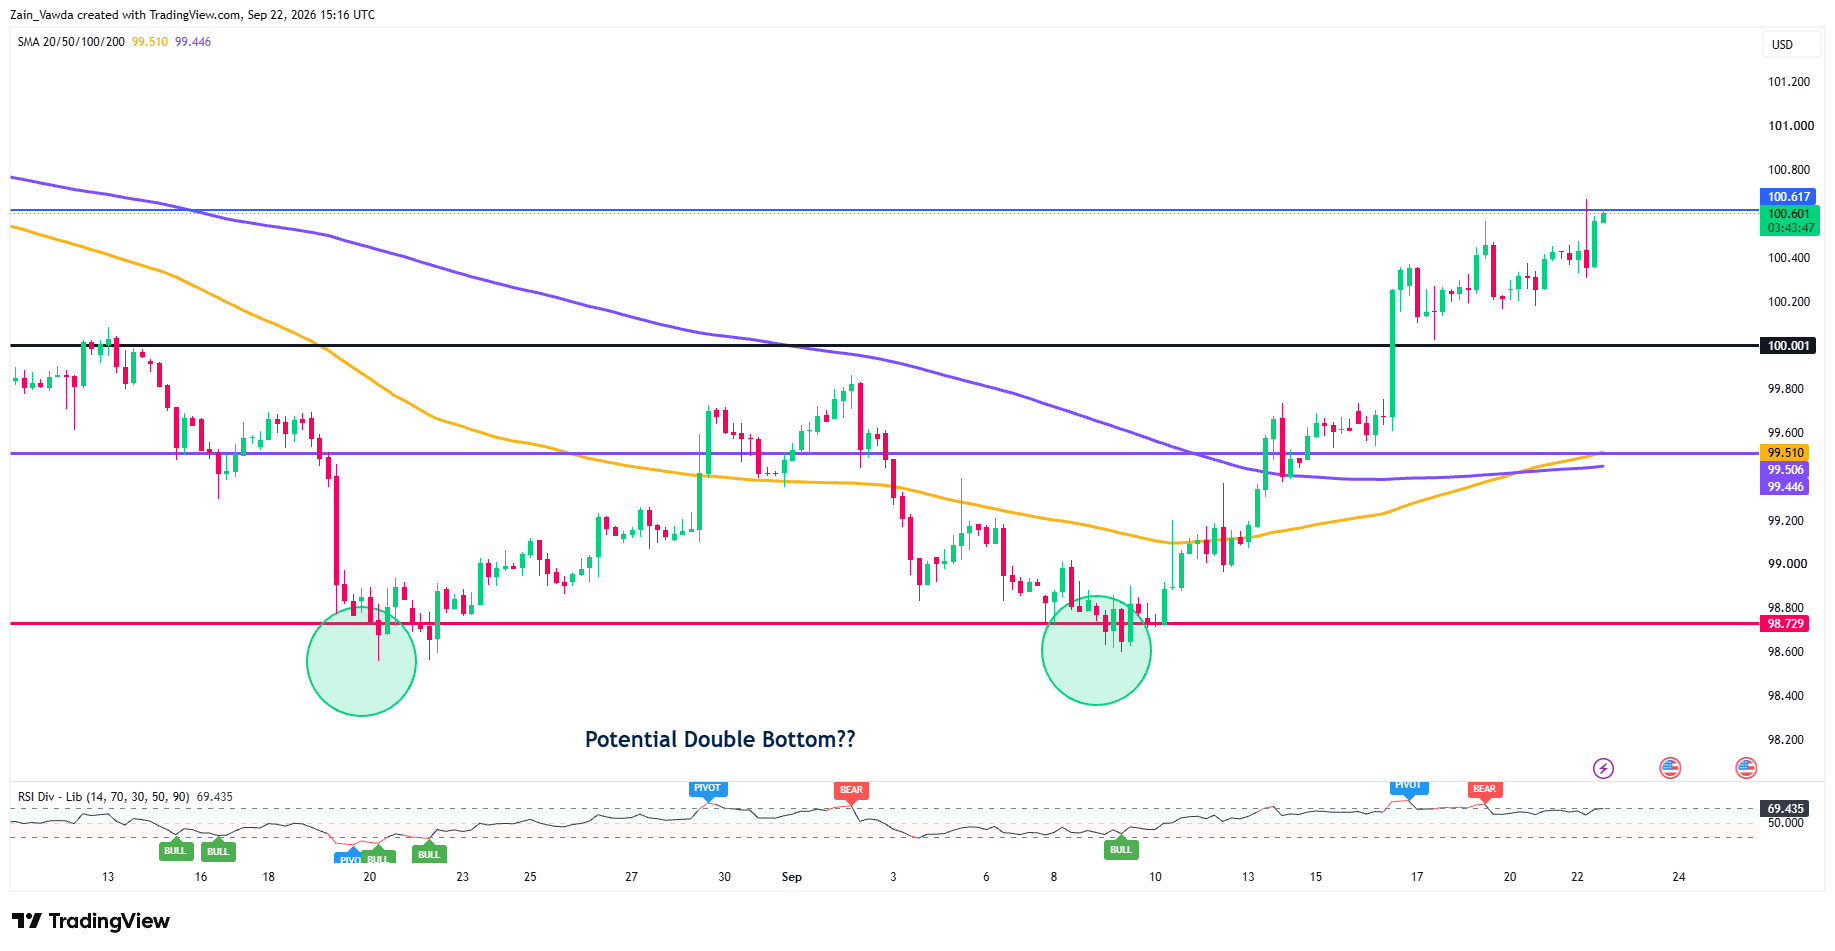
On the daily chart, DXY has been carving what looks like a double bottom, a bullish pattern where price tests the same floor twice and holds, hinting that sellers are exhausted.
US Dollar Index (DXY) Daily Chart, September 22, 2026
Source: TradingViews
Both dips found support at 98.729, and the index has since recovered above its moving averages and reclaimed 100.00.
The desk’s long-standing rule of thumb applies: reclaim 100.00 and the rate-hike bet is back on.
Momentum (RSI), a 0–100 gauge that flags “overbought” above roughly 70) sits at a healthy 65.9 firm, but not yet stretched.
Overhead, the next resistance shelf is 101.597, with the July high near 102.165 beyond it.
H4: the recovery has structure
Zoom into the 4-hour chart and the rebound is clean. Since the second low at 98.729, DXY has climbed in orderly steps, reclaimed every moving average, and pushed through 100.00 to test 100.617.
US Dollar Index (DXY) Four-Hour Chart, September 22, 2026
Source: TradingViews
Price now sits above a rising average cluster around 99.45–99.51, which flips to support on the way up.
The one caution: RSI at 69.4, is bumping against overbought, and the indicator has flagged a possible momentum stall near the highs.
That argues for a pause or a shallow dip before the next push, not a change of trend.
H1: testing the 100.617 ceiling
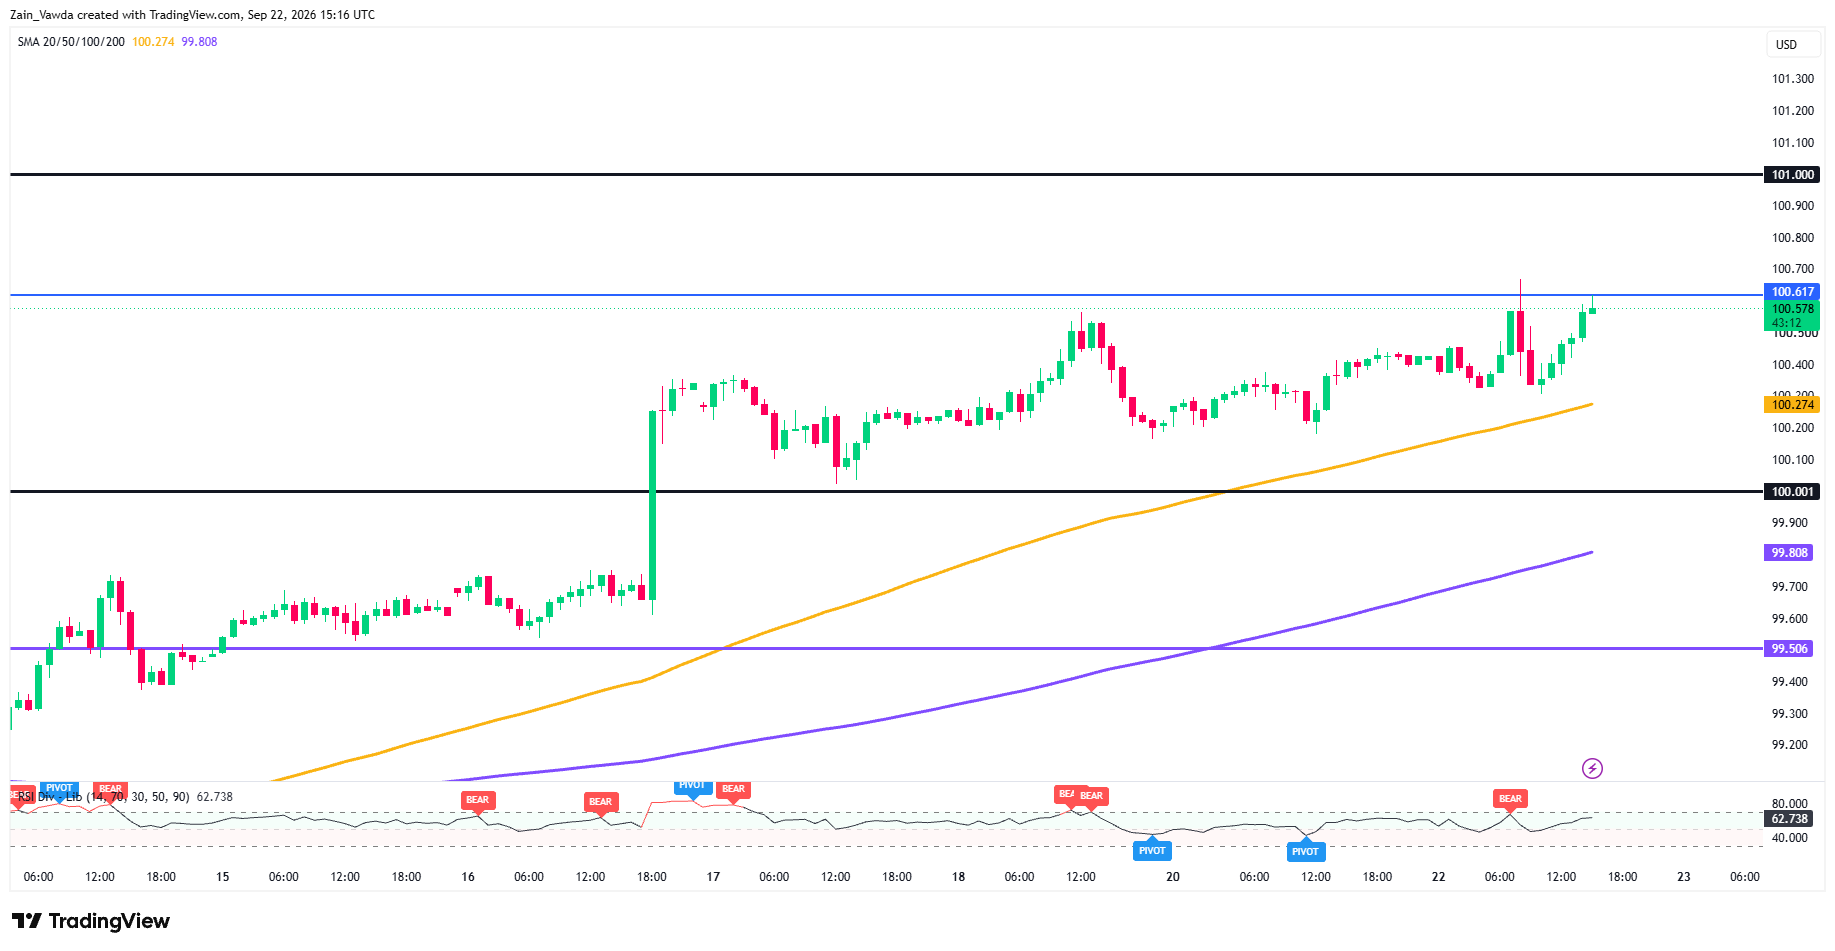
On the hourly chart, it is a grind higher into resistance. DXY broke above 100.00 in mid-September, built a base between roughly 100.10 and 100.60, and is now pressing 100.617 for another attempt.
US Dollar Index (DXY) One-Hour Chart, September 22, 2026
Source: TradingViews
The 20-period average near 100.27 is the first line of support on any pullback.
Momentum here keeps flashing short-term caution near the highs, so a rejection that sends price back to test 100.00 as new support would be normal — and, if that level holds, healthy for the trend.
Bull / Base / Bear: Keyed to the Fed–Iran Backdrop Into Thursday’s Trump–Xi Summit
| Scenario | The Read and Potential Outcomes |
|---|---|
| Bull | The hawkish-Fed chorus holds and Middle East risk keeps oil and inflation elevated. A daily close above 100.617 opens 101.00 and then 101.597. Buy dips into 100.00 while the double bottom holds. |
| Base | DXY chops between 100.00 and 100.617, working off overbought momentum while it waits on the summit and the next inflation print. Trade the range edges, fade the extremes |
| Bear | A friendly Trump–Xi summit plus a deeper oil pullback flips the oil–dollar link into reverse, softer inflation, lower hike odds, dollar back to 99.50 and then the 98.729 floor. A break below 98.729 kills the double bottom. |
In Short
This is the tape where discipline pays. Chasing DXY into 100.617 while the 4-hour RSI is near 69 and the hourly keeps flashing momentum warnings is exactly how late longs get trapped.
The higher-probability plan: wait for either a confirmed daily close above 100.617, or a dip that holds 100.00 before adding may be the smart play.