
Where We Left It: The Fed Was the Trigger, and It Fired
In our last note, the failed CLARITY Act was a sideshow and the Fed was the real event with the bear case needing a rate hike to crack the $75,000 floor.
That is exactly what landed. On Wednesday the Fed raised rates by 25 basis points (a quarter of a percentage point), and Chair Kevin Warsh struck a hawkish tone, saying he was “hard-pressed to call financial conditions restrictive” and signalling another hike could come this year.
Bitcoin did what a risk asset does when money gets more expensive: it fell toward $75,000. But here is the twist, it held. The $70K handle came into view, yet it was the $75K floor that did the talking.
Price has since recovered to roughly $76,300. Holding that line through a hawkish Fed doesn’t make the chart bullish on its own, but it tells you sellers haven’t been able to force a clean breakdown even with the Fed providing the catalyst.
The H4 Picture: Basing Above the 200-Moving Average, Capped by a Wall of Averages
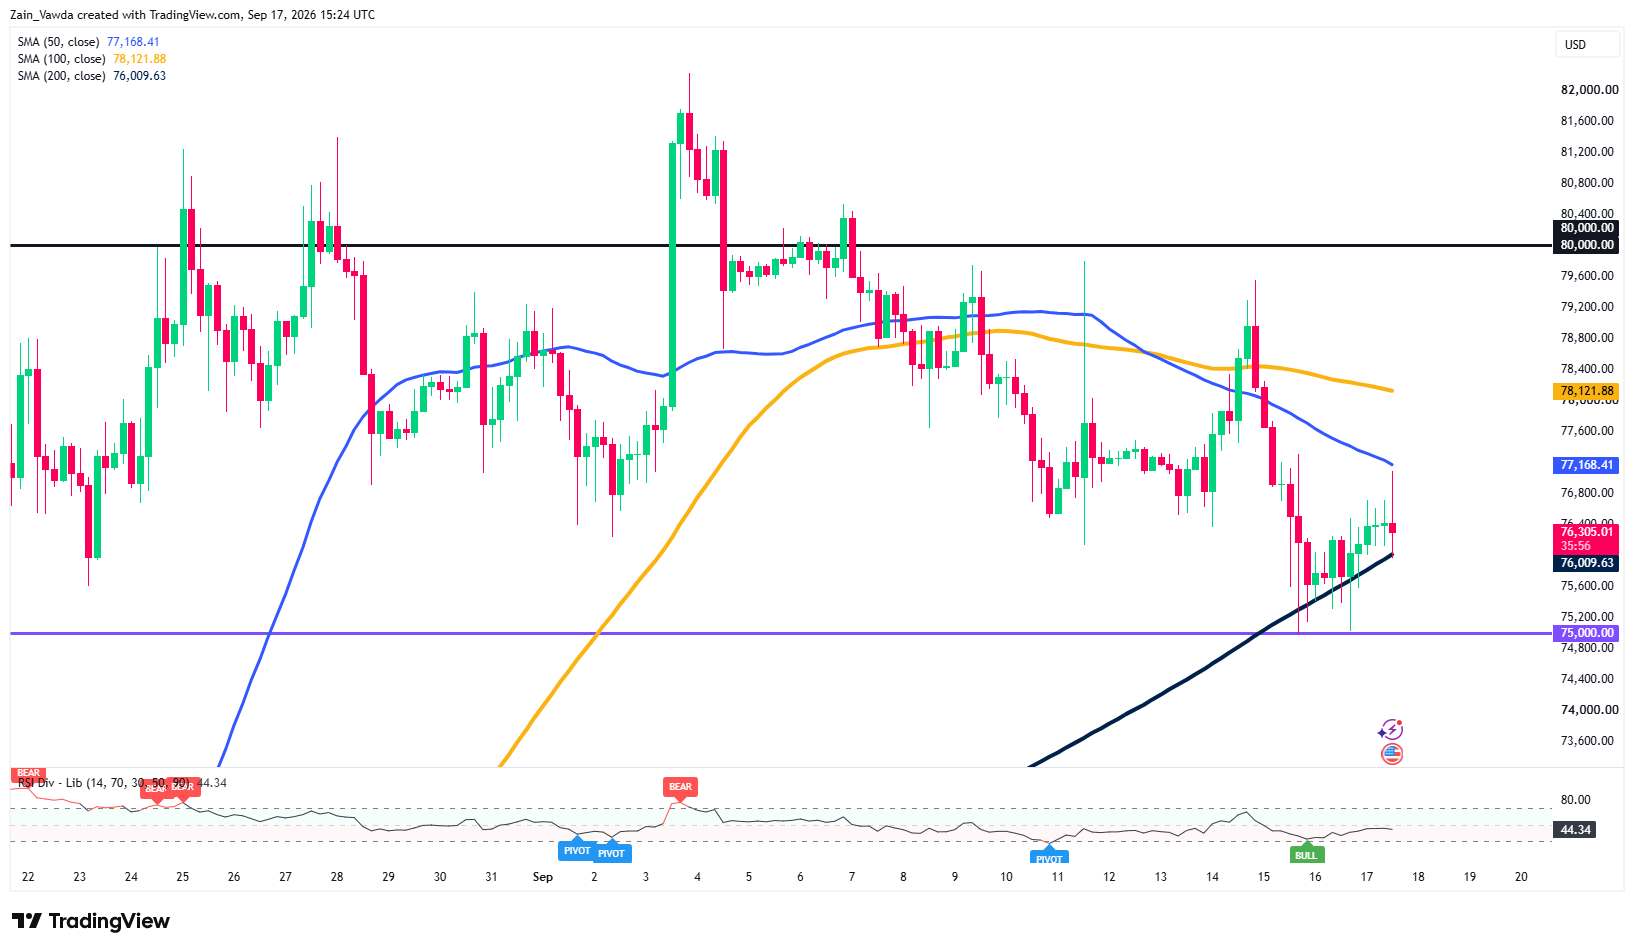
On the 4-hour (H4) chart, Bitcoin has reclaimed its rising 200-period average (~76,009) and is sitting on a rising trendline built from the September lows, the base is intact.
Bitcoin (BTC/USD) Four-Hour Chart, September 17, 2026
Source: TradingView
Momentum has improved too: RSI is back near 44 from the low 30s, and a bullish divergence has appeared at the lows (price made a lower low while momentum made a higher one), the reversal hint that was missing two days ago.
The catch is overhead: the 50-period average (~77,168) is still below the 100-period (~78,121), a bearish stack, and $80,000 caps the whole range. So the structure is “basing under a ceiling,” not “breaking out.”
The H1 Picture: Reclaimed One Average, Fighting the Next
Zoom into the 1-hour (H1) chart and you can see the tug-of-war.
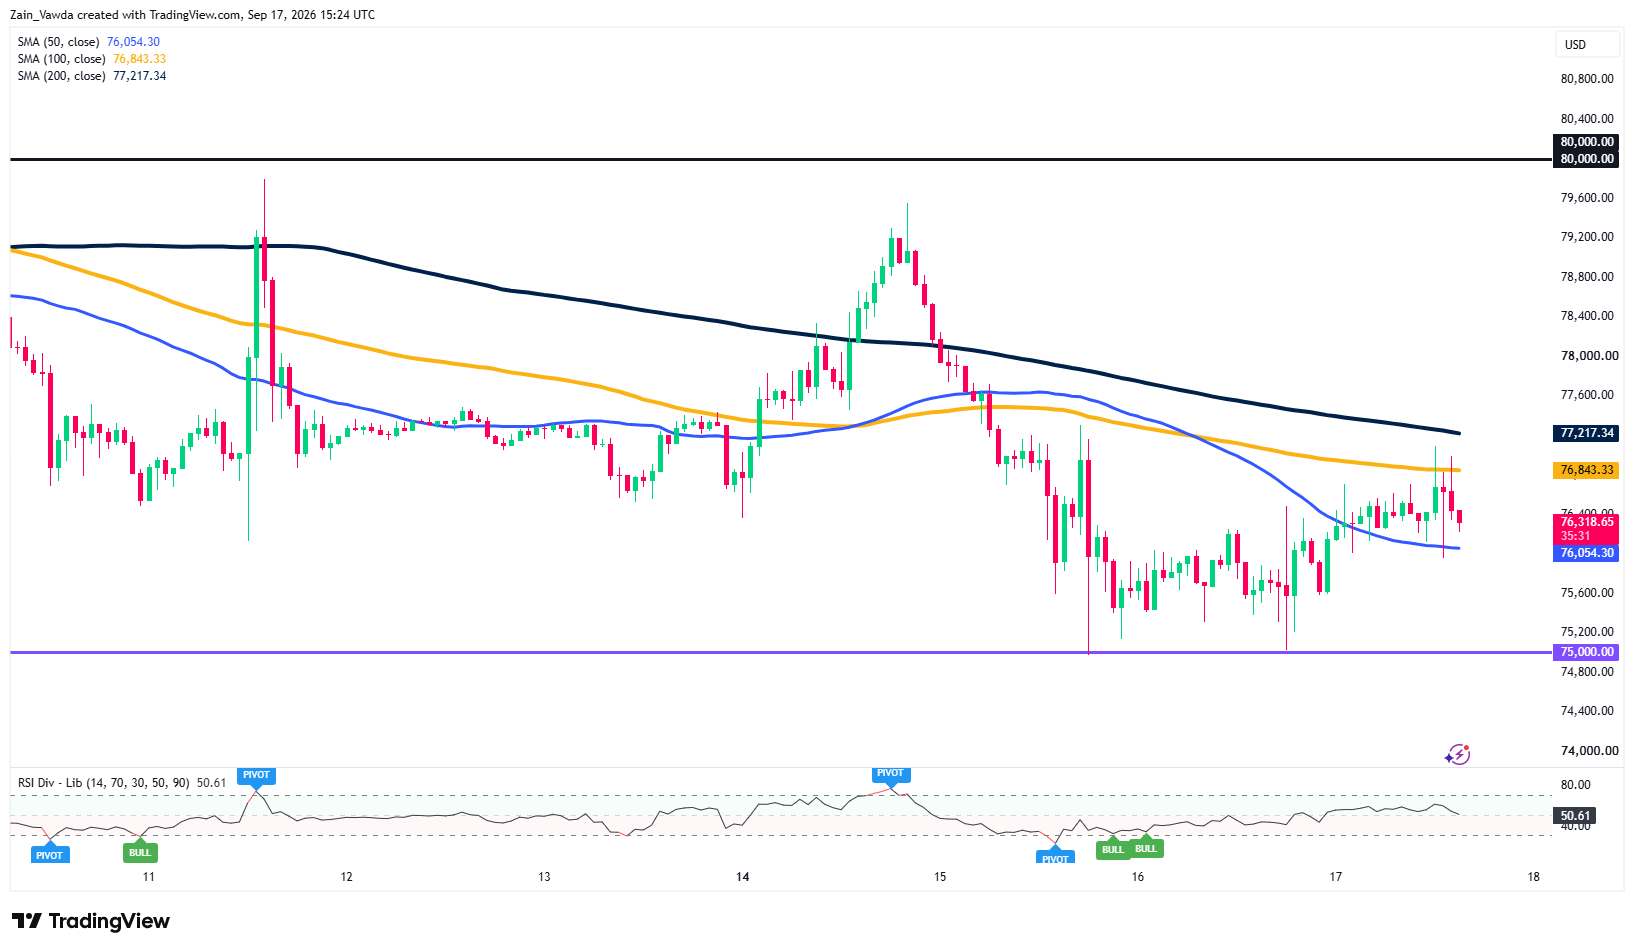
Price has climbed back above its 50-period average (~76,054) but is pinned under the 100- and 200-period averages (~76,843 and ~77,217), which sit close together and form the first real hurdle.
Bitcoin (BTC/USD) One-Hour Chart, September 17, 2026
Source: TradingView
RSI has recovered to the 50 mid-line, neutral, neither strong nor weak. The message is simple: 76,843 is the line to beat. Reclaim it and the H4 ceiling near 77,200 comes next; fail, and the 76,000 shelf and then 75,000 are back in focus.
The Flows Tell: A Bounce Nobody is Funding
Here is the part the price chart hides.
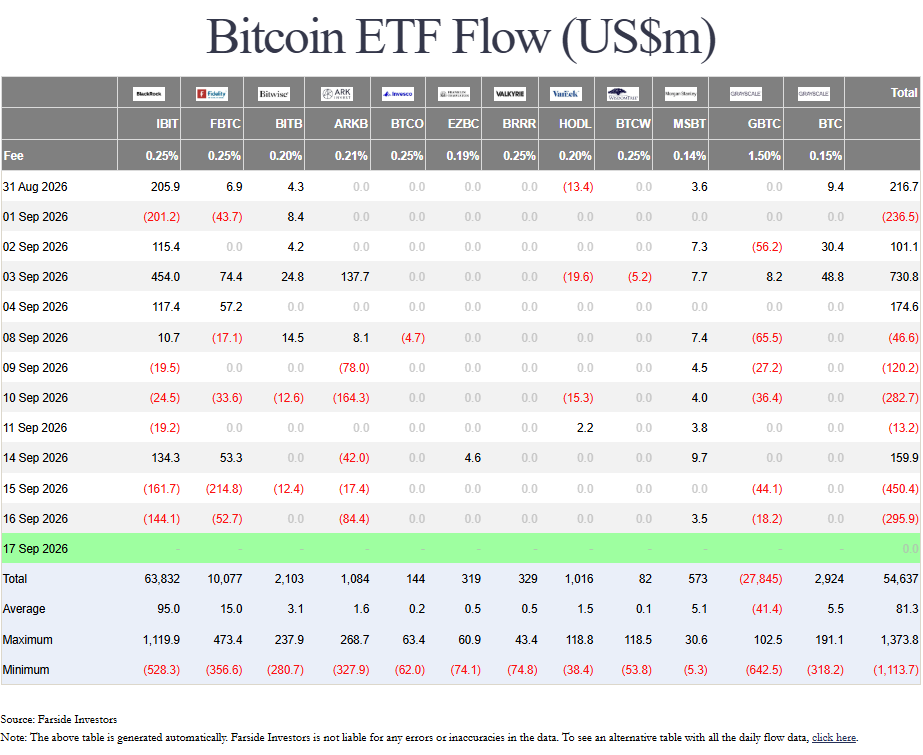
ETF flows are the money moving in or out of the US funds that hold Bitcoin for investors, a clean read on institutional demand. And that demand has been leaving.
Source: Farside Investors
The two sessions around the Fed saw roughly $746 million of net outflows (−$450.4m on Sep 15, −$295.9m on Sep 16), and even BlackRock’s IBIT, the flagship and the usual demand bellwether bled $144m on hike day.
When IBIT leads the outflows, it points to broad, macro-driven de-risking rather than a quirk of one fund.
So What is the Next Move?
Put the two together and Bitcoin is coiling, squeezed between the 75,000– 76,000 support shelf and the 76,843– 78,121 wall of averages.
The technicals lean cautiously constructive (floor holding, bullish divergence, 200-average reclaimed); the flows lean cautious (money still exiting). That mix usually resolves with a clean break of one edge, not a drift.
The tell is whether ETF flows flip positive: a green print or two would give the bounce the fuel it lacks and argue for a push through 76,843 toward 78,121 and a retest of $80,000.
Keep the outflows going, and the likelier path is another test of $75,000 and a break there re-opens $73,000– $74,000 and the $70,000 handle from our last piece.
How Will It Break?
Potential Scenarios
| Scenario | What It Looks Like and What Drives It |
|---|---|
| Bull | A clean move back above 76,843 opens the 77,168– 77,217 band; clear that and 78,121 then 80,000 come into play. This needs the ETF outflows to stop, ideally flip positive plus steadier yields and a calmer risk mood. |
| Base | Bitcoin keeps coiling in the 75,300– 76,900 range, chopping between the support shelf and the moving-average ceiling while the market waits for the next macro cue. The bounce holds, but without ETF buyers it doesn’t build into a trend. |
| Bear | A decisive drop through the 75,000– 75,300 floor reactivates the bear case from our last piece: 73,000– 74,000 first, then the 70,000 handle. Trigger: outflows accelerate, yields push back toward 5%, or a hawkish Fed speaker. |
For the Trader
In a coiling market the trap is picking a side in the middle, buying because “it held $75K” or shorting because “the Fed is hawkish”, then getting chopped as price ping-pongs between the shelf and the ceiling.
The traders that usually do well let the edge break first: a reclaim of 76,843 (ideally with flows turning) or a clean loss of 75,000, risk defined on the other side of the line.
When the chart says “basing” and the flows say “selling,” waiting for one of them to win is the trade with the best probability of success.