Pull up the S&P 500 and the Dow side by side this morning and you would think they were trading two different economies.
The S&P (ES) is clawing back toward resistance; the Dow (YM) is sliding to fresh lows with sellers still in control. Same market, same Fed, two very different charts and roughly two and a half hours before the decision, that gap is the trade.
S&P 500 (ES): a recovery running into a wall
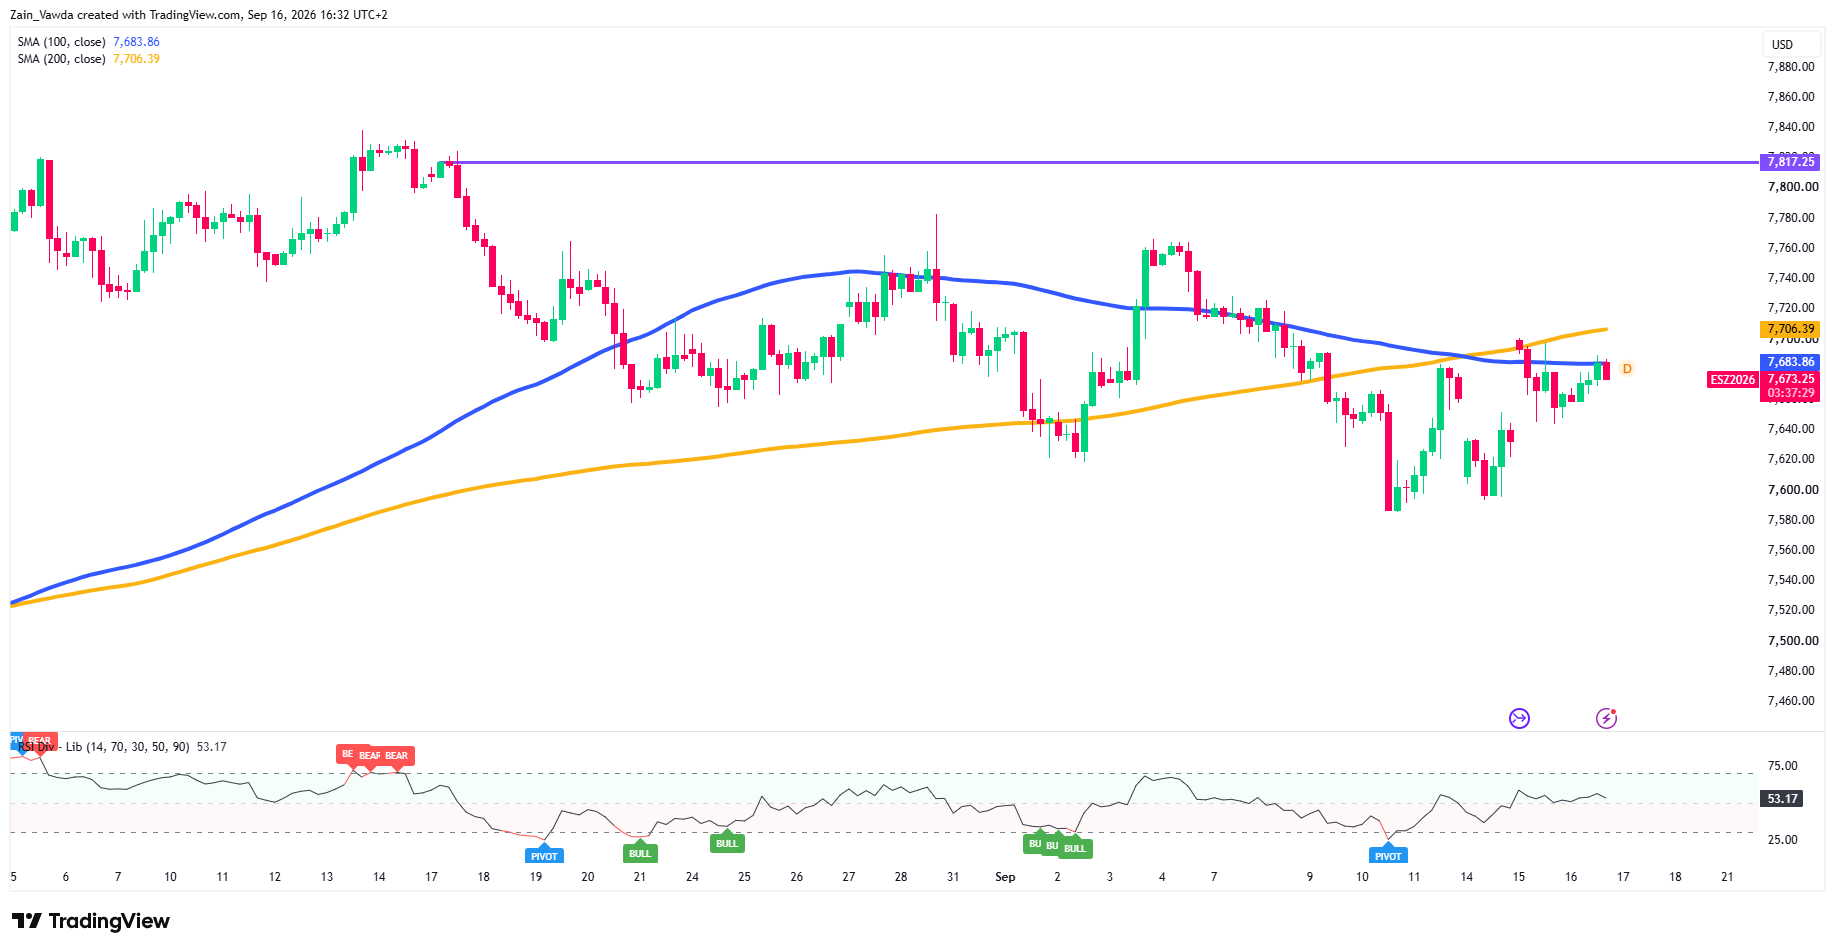
On the four-hour chart, the one that shows the bigger trend, price is near 7,673 and is still below both slow trend lines (the 100-period average at 7,684 and the 200 at 7,706), and both are tilted gently down. So the larger trend is still soft, but price has bounced hard off the ~7,580 low and is climbing back toward those averages, with the next big shelf overhead at 7,817 (the prior swing high).
S&P 500 Four-Hour Chart, September 16, 2026
Source: TradingView
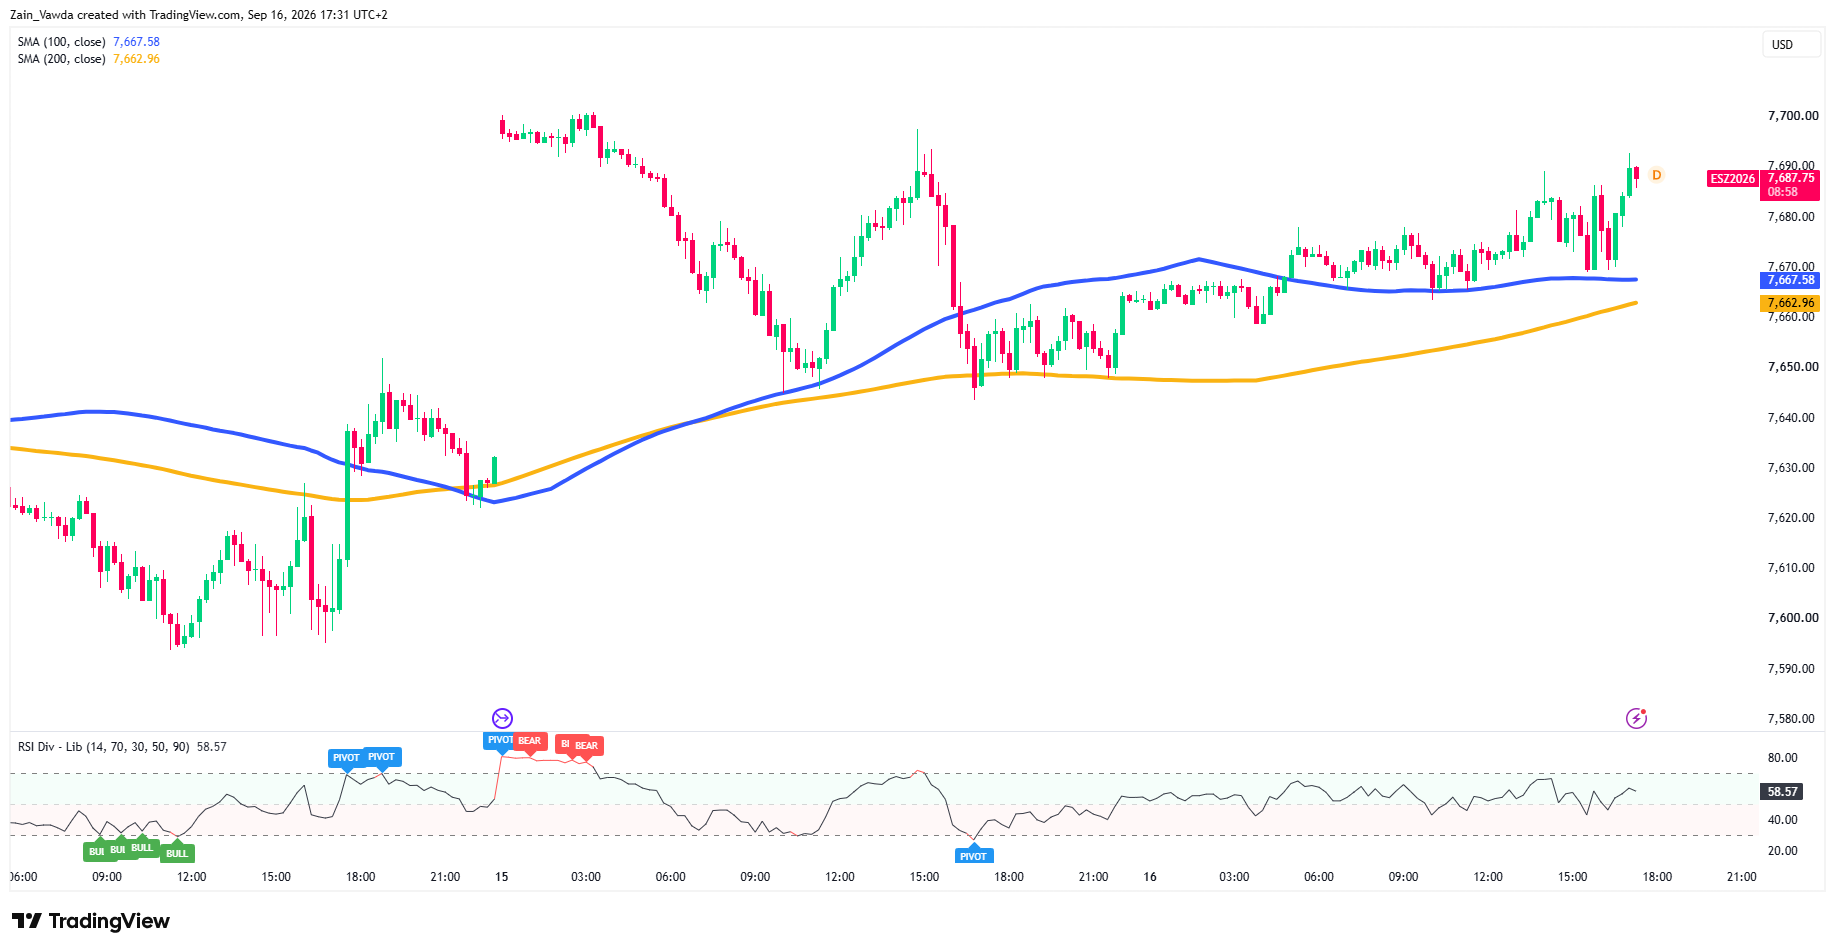
Zoom into the one-hour chart and price is pressing right up against its 200-period average around 7,674, the first ceiling it has to clear and hold.
On the 15-minute chart the short-term picture is actually bullish: the fast average has crossed back above the slow one and price sits above both, which is the engine pushing ES up into that resistance. The catch is momentum (RSI) has cooled to the mid-40s right at the wall, a recovery arriving a little tired.
S&P 500 M15 Chart, September 16, 2026
Source: TradingView
Dow (YM): A Rollover with No Floor Yet
The Dow is the mirror image.
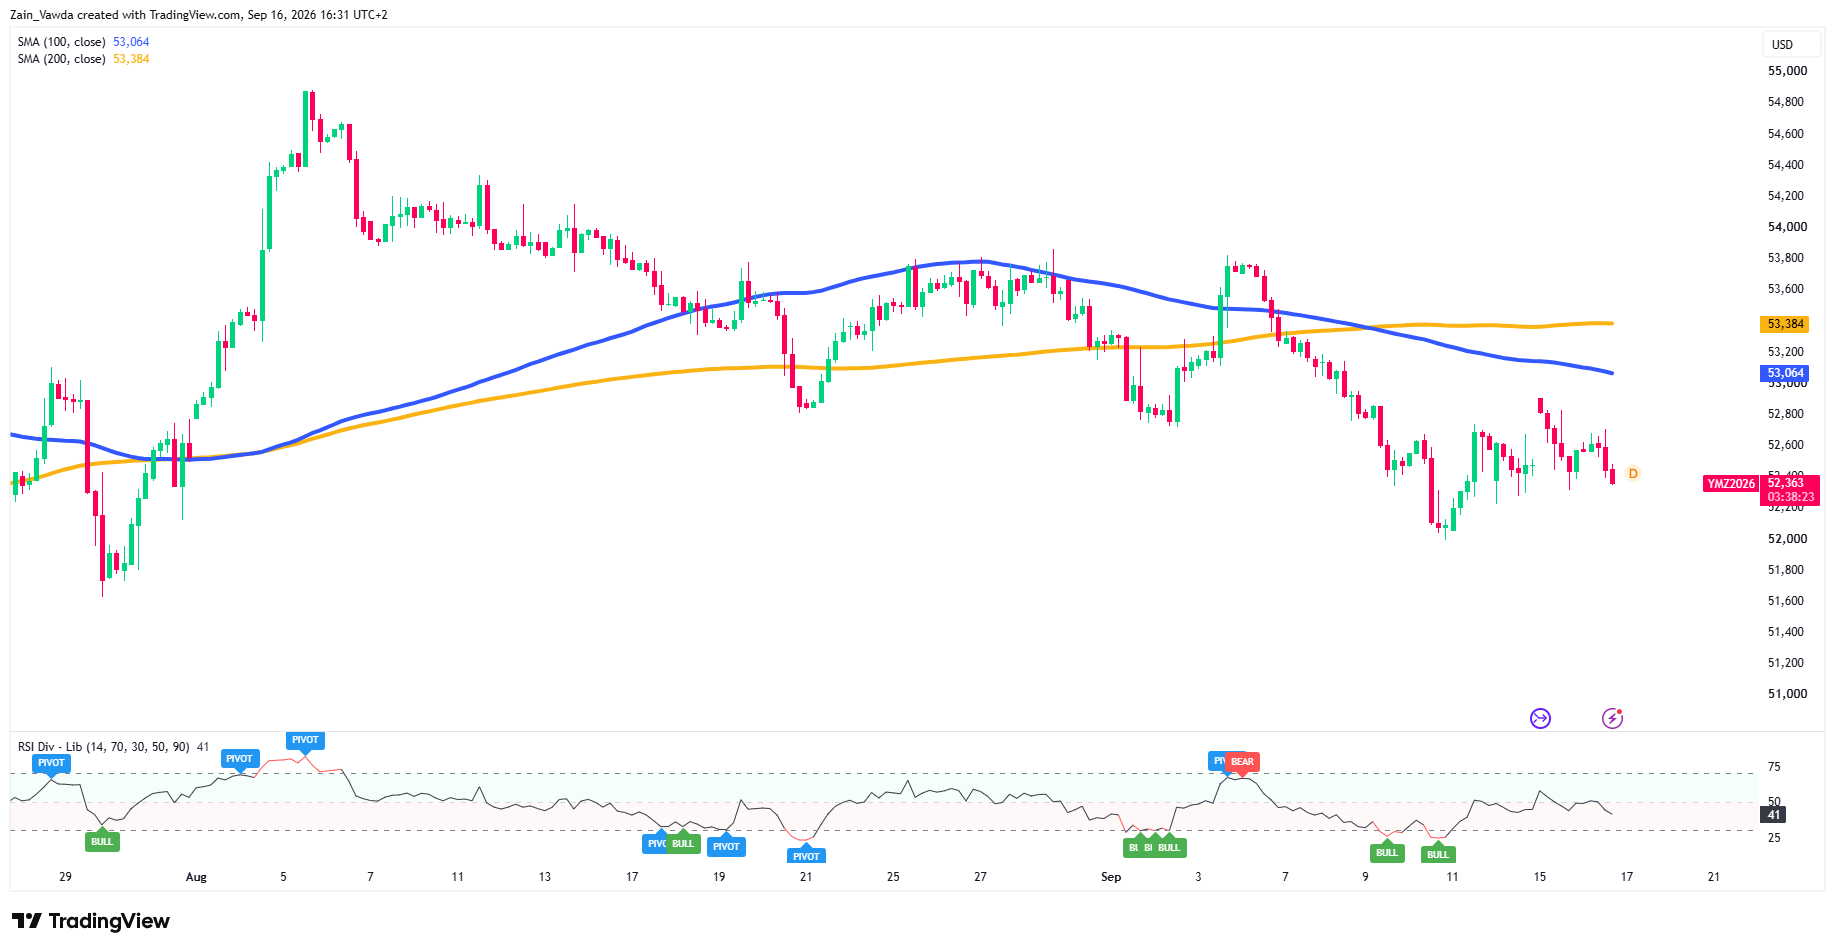
On the four-hour chart price near 52,363 is well below both falling averages (100 at 53,064, 200 at 53,384), a clean downtrend off the ~54,800 highs.
Dow Jones Four-Hour Chart, September 16, 2026
Source: TradingView
The one-hour chart says the same: price under both declining averages with momentum grinding lower.
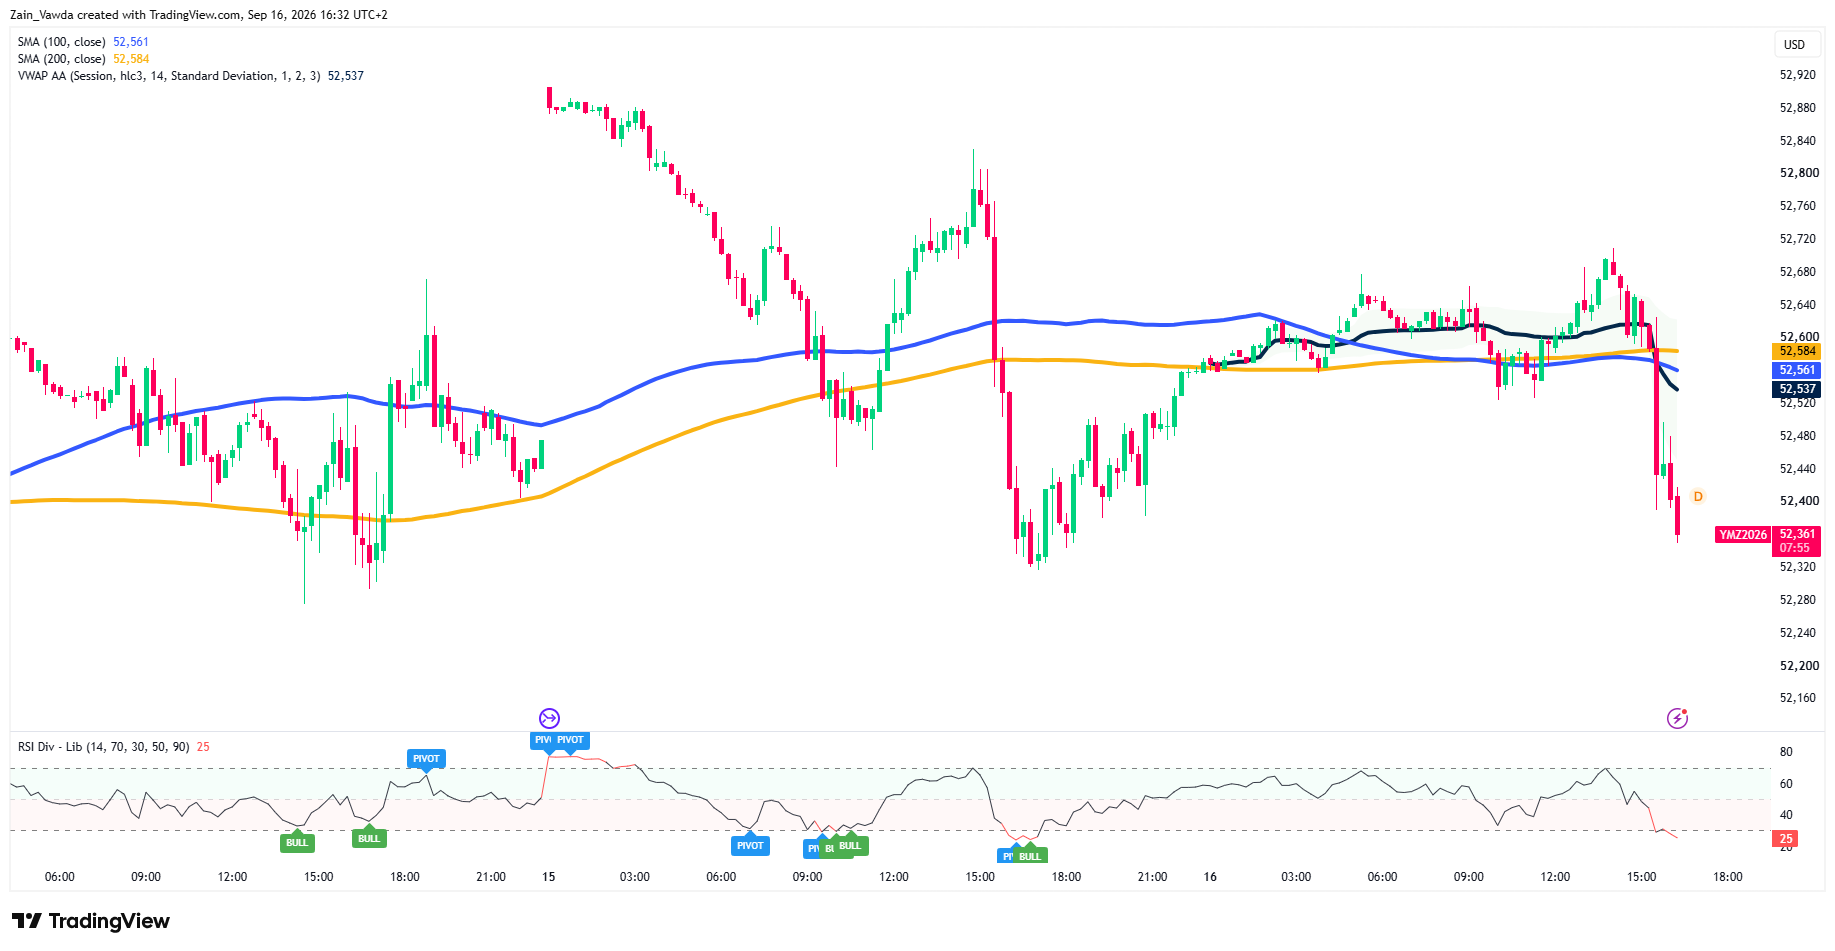
And the 15-minute chart just took a sharp leg down to the lows, dropping below the day’s fair-value line (VWAP at 52,537) with RSI at ~25, oversold enough for a bounce, but the move itself shows who is in charge.
Nothing here is recovering the way ES is.
Dow Jones M15 Chart, September 16, 2026
Source: TradingView
The Play: Trade the Gap, Not the Guess
Into a decision that is ~93% priced for a 25bp hike, betting a naked direction is a coin-flip.
The cleaner read is the dispersion: ES is the stronger structure, YM the weaker one. The house approach is to express the view through the stronger index and lean against the weaker, long-ES-versus-short-YM in spirit, rather than picking a side and hoping.
The Fed then resolves the split: a softer-toned hike (flatter dots) could let ES break 7,706 while a beaten-down YM bounces from oversold; a hawkish dot plot that pushes yields higher likely widens the gap, extending the Dow’s slide.
Scenario Matrix: Keyed to the 2:00 Decision
| Scenario | What It Takes (The Fed) | What ES & YM Do |
|---|---|---|
| Bull (equities) | Hike lands as priced, but the tone and dots signal it is near the end | ES clears 7,706 toward 7,817; YM reclaims 52,590 |
| Base | 25bp hike, Warsh stays non-committal | Split persists, ES chops under 7,674, YM stays heavy but tries to base; ranges hold |
| Bear (equities) | Hawkish dots flag more tightening; yields push higher | ES loses 7,650 back toward 7,600 / 7,580; YM breaks 52,320 toward 52,000 |
The edge on Fed day is discipline, not prediction.
The durable pattern: accounts that survive let the first post-2:00 move overshoot and fade the panic, rather than stacking directional risk at 1:59. A dispersion stance also caps single-index blow-up risk if the reaction is violent.
Keep an eye on the latest positioning data using the Positioning Edge Data provided on MarketFramework.