
The three major U.S. stock indices are lower at midday, dragged down by a sell-off in AI-linked shares after the industry’s own leaders called for a slowdown in the pace of AI development. But the selling has not gone unchallenged.
Many traders and analysts are openly doubting the warnings. Gil Luria of DA Davidson argued the big AI firms are simply “pulling up the ladder”, using safety fears to push regulation that would slow their rivals down.
Edward Jones strategist Brock Weimer said the story could weigh on markets for days or weeks as investors weigh the hit to company profits, but still called the wider economy “supportive” for stocks.
U.S. President Donald Trump also hit back hard at the calls for tighter AI rules.
That tug-of-war is written all over the NQ, the Nasdaq 100 E-mini futures where prices fell hard in the morning, then snapped straight back.
Here is what the charts say now.
The 1-hour Chart: A Bounce Into the Moving-Average Ceiling
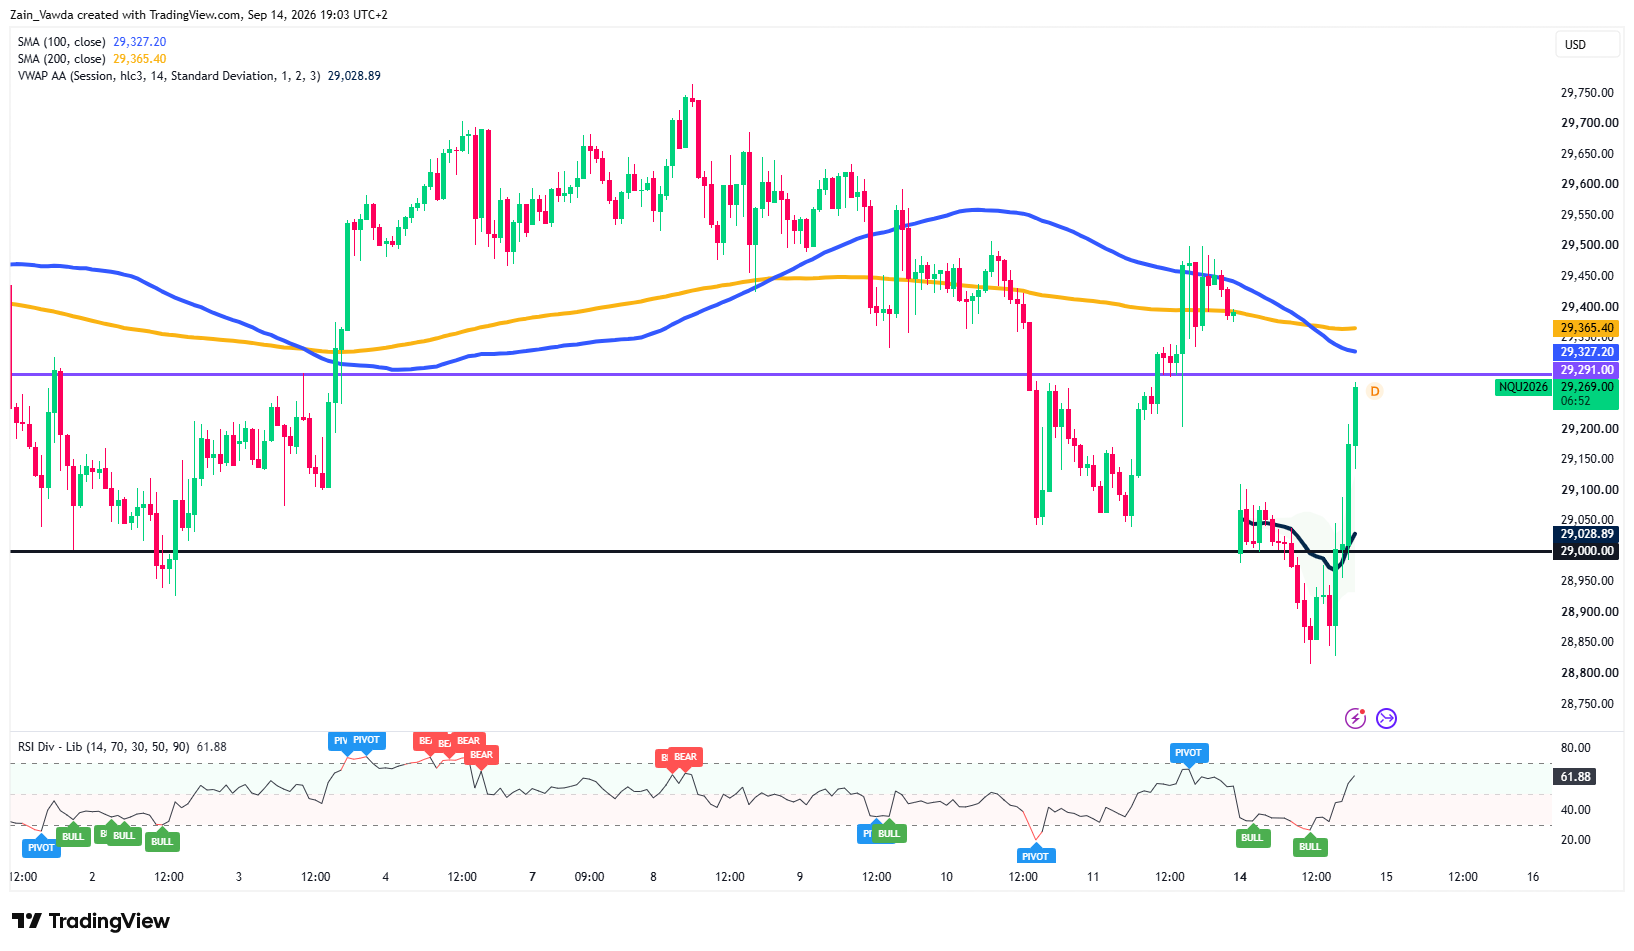
Nasdaq (NQ) One-Hour Chart, September 14, 2026
Source: TradingView
First, three tools to read the chart in plain terms. The blue and orange lines are the 100- and 200-period moving averages (MA).
When price sits below them, they tend to act as a ceiling (resistance). The black line near 29,000 is VWAP, the volume-weighted average price, or the average price actually paid this session, which traders use as a fair-value line.
NQ slid from the 29,700 area earlier in the month down to a Monday low near 28,850. That is where buyers stepped in.
Price bounced off the lows and bounced off the VWAP line, a clear support shelf marked in black and has surged back to 29,269.
The catch is that the recovery is running straight into resistance. The purple line at 29,291 sits just overhead, and immediately above it the 100-period MA (29,327) and 200-period MA (29,365) form a tight resistance band.
This is the exact zone where the earlier downtrend’s average prices now sit, so it is the first real test for the bounce.
The hourly RSI reads 61.88, rising and constructive, with room to climb before it gets stretched. On this timeframe the recovery still has fuel, but it has not yet broken the ceiling.
The 15-Minute Chart: A Strong Thrust, but Overbought
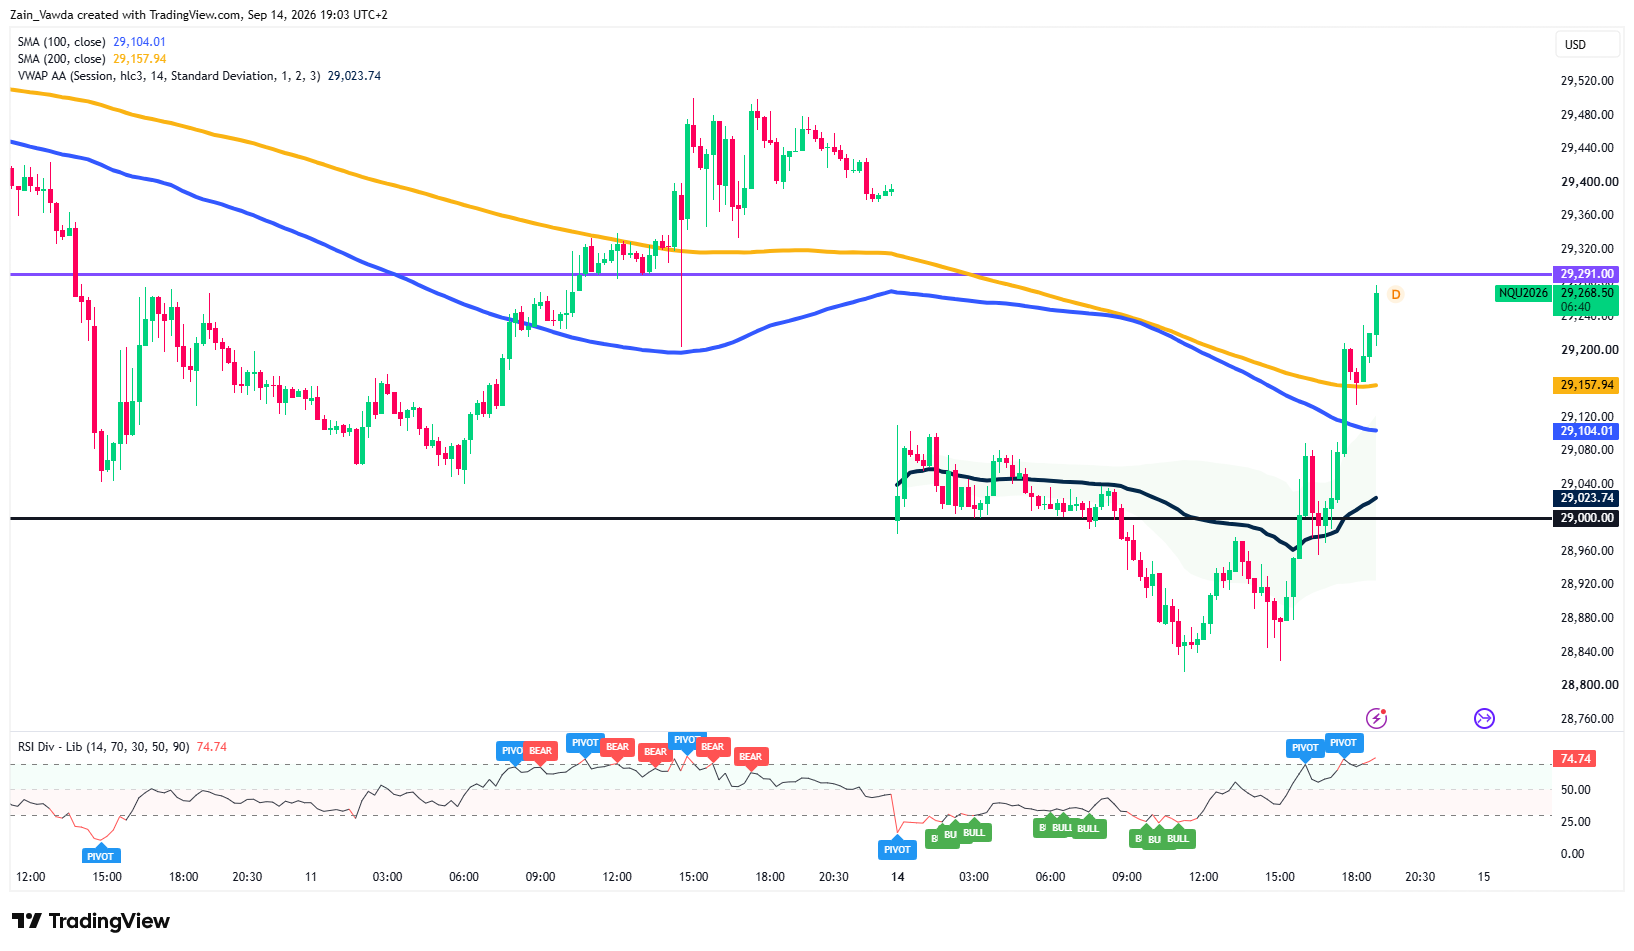
Nasdaq (NQ) M15 Chart, September 14, 2026
Source: TradingView
Zoom in and the move looks even sharper.
The last leg up is almost vertical: price ripped from about 28,850 through VWAP (29,024), through the 15-minute 100-MA (29,104) and 200-MA (29,158), and up to 29,268 in a short burst.
Those two moving averages have now flipped from ceiling to floor, they are the first supports if price pulls back.
But the speed comes with a warning. The 15-minute RSI is at 74.74, firmly in overbought territory. In plain terms, the intraday move is stretched, it has come too far, too fast to keep rising in a straight line.
That does not mean it reverses; it means a pause, a sideways grind, or a small dip to reset momentum would be normal and healthy before any further push.
Note the two “PIVOT” tags the momentum tool has printed near the highs, an early sign the surge is losing its first burst of speed.
Key Levels Into the Afternoon
Resistance (the ceiling). 29,291 is the purple level directly overhead. Just above, 29,327 and 29,365, the 1-hour 100- and 200-MA band are the real barrier. Beyond that sit 29,400 (prior congestion) and 29,520 (the recent spike high).
Support (the floor). 29,158 and 29,104, the 15-minute moving averages are the first cushion. Below them, 29,024 (VWAP) and the 29,000 round number that launched the bounce.
A break of 29,000 puts Monday’s 28,850 low back in play.
Trader Positioning Data
The NQ positioning data on MarketFramework shows an extreme bearish divergence between winning and losing traders.
Profitable traders are currently 22% more short than unprofitable traders, leaning heavily into the ongoing market decline. While 69% of unprofitable traders are positioned long in hopes of a price rebound, successful traders are taking the opposite view, with only 31% holding long positions.
This gap highlights that experienced traders are aligned with the downward momentum, whereas retail traders are attempting to buy into weakness.
Ultimately, the strong short bias among profitable accounts indicates smart-money confidence that NQ may face continued downside risk.


