
The S&P 500 Index (SPX) has rebounded sharply this week and is closing in on its peak, but weakening participation beneath the surface is creating a growing divergence between headline performance and market breadth.
The S&P 500 is once again within striking distance of its record high.
After stumbling following the Federal Reserve's latest policy decision, the benchmark index has staged a strong rebound this week, recovering much of its lost ground and moving back toward its peak. The recovery has restored bullish momentum to the headline index but underneath the surface, the market's internal picture is considerably less convincing.
That divergence is becoming one of the key themes for traders heading into the next phase of the rally.
Price Action Says Bullish Momentum
The simplest message from the market remains constructive: the S&P 500 is rising. The index has absorbed the post-Fed pullback and quickly regained ground, demonstrating that buyers remain willing to step in on weakness. The Nasdaq has also pushed into record territory, reinforcing the strength of the technology and artificial intelligence (AI)-led portion of the market.
With the S&P 500 only about 1% below its record, another push higher would put the index back within immediate reach of an all-time high.
But the rally is not being confirmed equally across the market.
Breadth Is Telling a Different Story
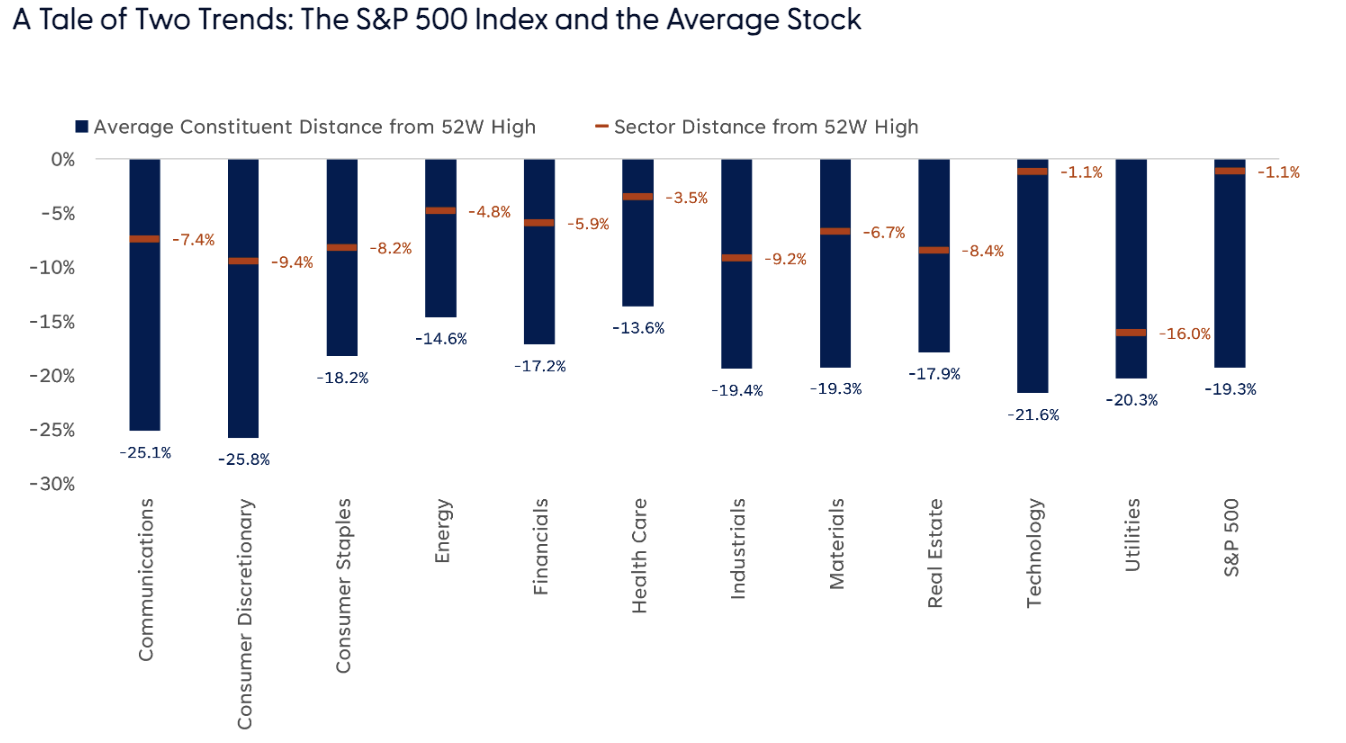
The concern is participation. While the S&P 500 has moved higher, a significant portion of its components remain well below their individual highs. Leadership has continued to be concentrated in large-cap technology and other major index constituents, allowing the capitalization-weighted benchmark to outperform broader measures of the market.
Distance from 52-Week High (Average Constituent Vs. Sector)
Source: LPL Research
That creates an important distinction: the S&P 500 can approach a record even when a large part of the market is not participating at the same level.
LPL Research has highlighted the importance of market breadth as the index approaches new highs, noting that the path to a sustained advance becomes more convincing when participation expands. For now, breadth remains the market's principal warning signal.
Ryan Detrick: Strong Momentum Can Persist
There is, however, an important counterargument to the breadth concerns. History does not necessarily favor selling simply because the market looks stretched.
Ryan Detrick has highlighted several historical data points showing that unusually strong S&P 500 momentum has often been followed by additional gains rather than an immediate reversal.
Out of the four-year presidential cycle, the third and fourth quarters of a mid-term year have been the strongest, the strategist said.
https://x.com/RyanDetrick/status/2103458351615238346
The implication is important. A market that has already risen substantially is not automatically a market that is about to fall. Historically, strong momentum has frequently demonstrated persistence.
That provides a bullish counterweight to the increasingly narrow participation beneath the surface.
History Gives the Bulls Another Argument
Research highlighted by Patient Investor adds to that historical case. When the S&P 500 has posted double-digit gains through the first eight months of the year, the market has historically delivered positive returns over the subsequent 12 months in the vast majority of instances.
The takeaway is not that history guarantees another advance. Rather, strong year-to-date performance has historically been more consistent with continued momentum than with an imminent exhaustion of the trend.
Peter Mallouk has highlighted a similar historical tendency, pointing to the tendency for years that start strongly to maintain positive momentum.
Together, these observations complicate the bearish interpretation of today's stretched conditions. Weak breadth is a warning but it is not, by itself, proof that the rally is over.
The Market's Two Signals
That leaves the S&P 500 caught between two very different signals.
The price is bullish. Breadth is cautious. History is providing a bullish counterweight.
The index's rebound this week shows that buyers remain in control of the headline trend. A move back above the record high would reinforce that momentum.
But if the S&P 500 continues higher while fewer stocks participate, the divergence between index performance and market internals will become increasingly difficult to ignore.
Conversely, a broadening of participation, i.e. more stocks making new highs, fewer making new lows and stronger performance outside the mega-cap leaders, would provide stronger confirmation of the advance.
Multi-Timeframe Charts Align: Structure Intact, Breakout Level in Sight
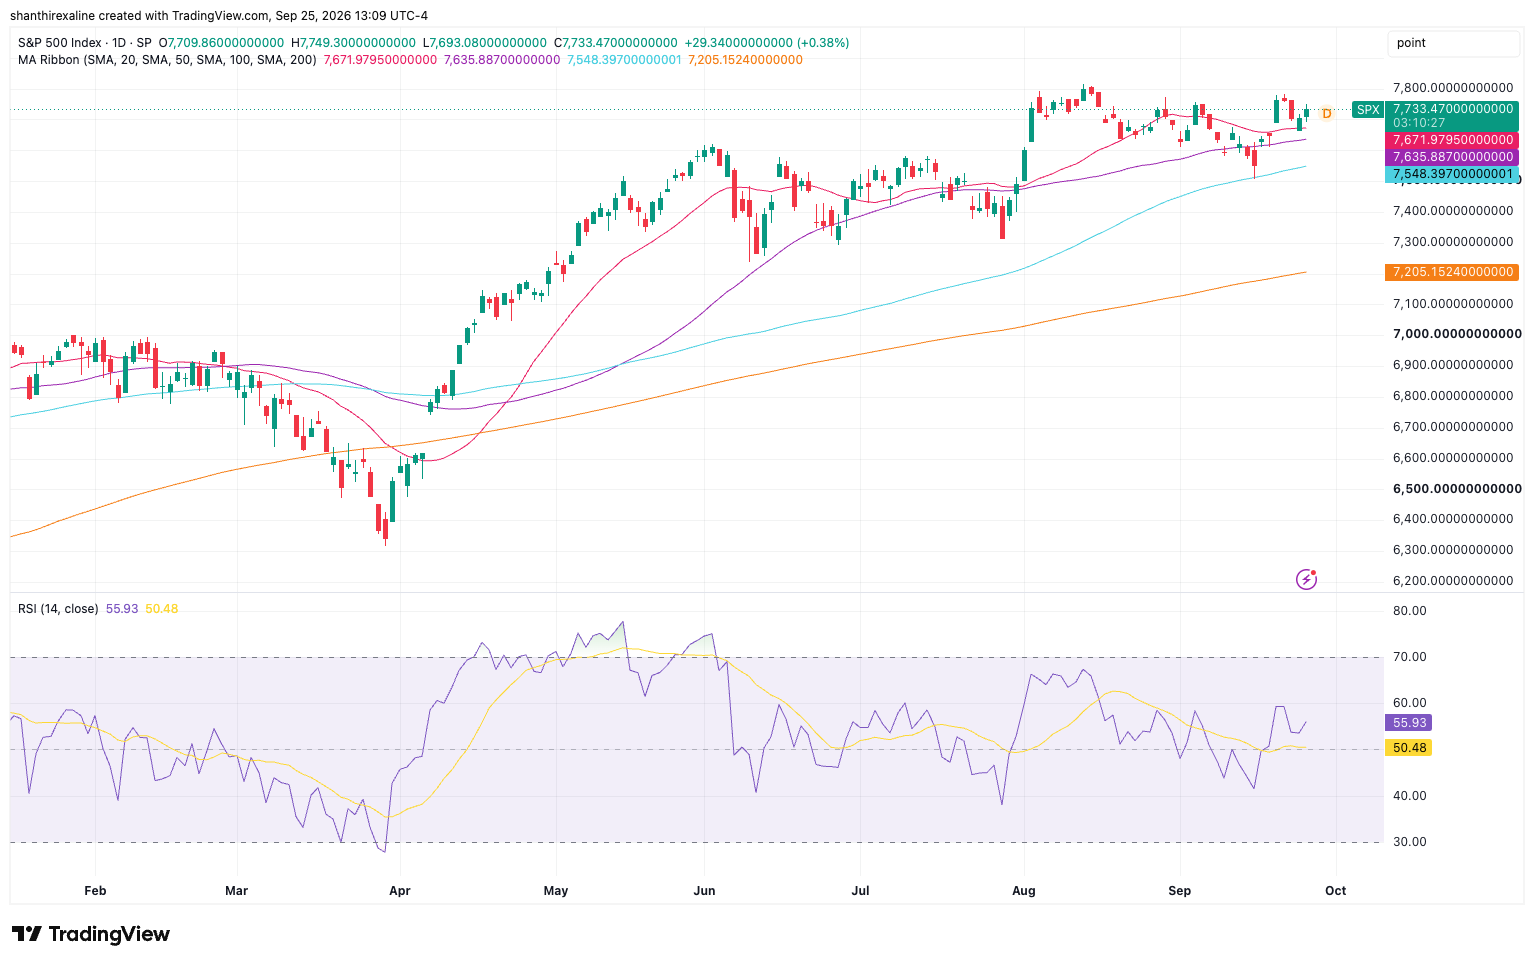
SPX at around 7,733 sits just below the recent swing high of 7,740, in a well-defined uptrend since the April low near 6,650. The moving average ribbon is in a clean bullish sequence, with price above all four, signaling a healthy bullish stack. The relative strength index (RSI) in the daily chart is at 55.9, well off the overbought reading from the April/May melt-up. The past six weeks have been more of a grinding, choppy advance than the sharp rally that preceded it.
Source: TradingView
Zooming into the last month (hourly chart) shows price oscillating in a rough 7,600-7,780 band. Hourly RSI is also in neutral zone (58), and the price has reclaimed both 100- and 200-period moving averages, a short-term bullish reset after the shakeout.
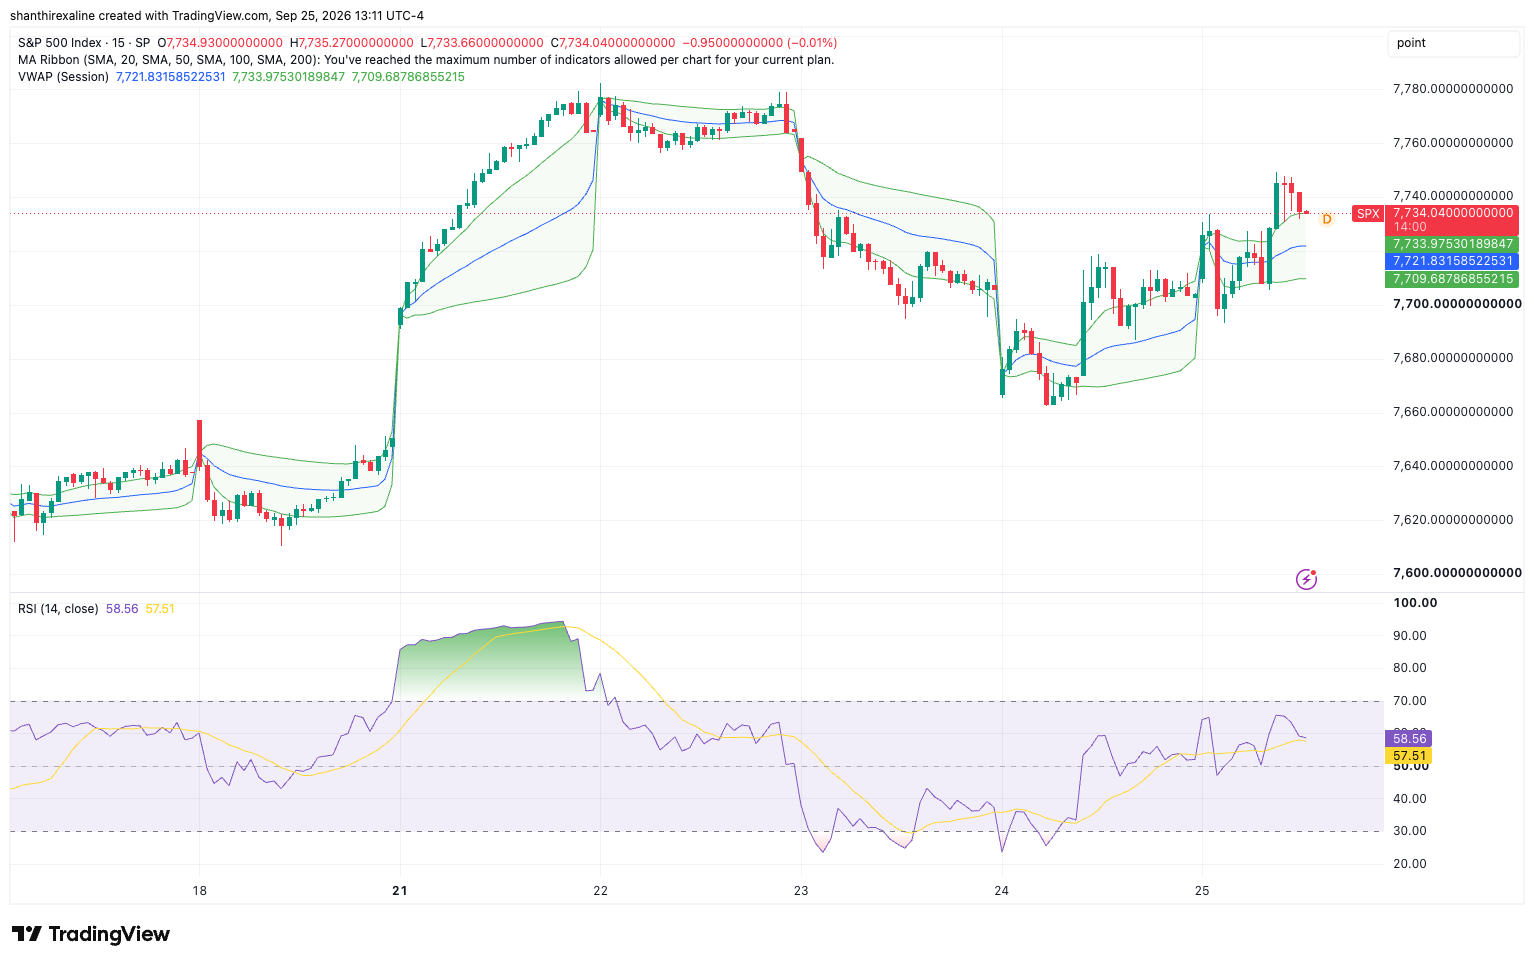
The 15-minute intraday tape shows price consolidating tightly just above the upper VWAP boundary. Holding above the upper VWAP boundary keeps the near-term bias constructive, with a sustained breakout potentially opening the way toward higher resistance. A move back below the boundary would weaken the setup and shift attention toward VWAP support.
Source: TradingView
However, positioning in the ES futures, which are tied to the S&P 500 Index, shows less conviction among futures traders (only 29.2% are long). According to MarketFramework’s Positioning Edge tool profitable traders are 31.3% long compared to the not-so-successful traders, who are 25% long. The data suggests better-performing traders have somewhat greater upside exposure, but the narrow gap signals limited conviction.
If ES continues higher, the relatively light long positioning could leave room for short covering and additional upside, while a break lower could reinforce the existing bearish positioning.
What Traders Should Watch
The next test is therefore bigger than simply whether the S&P 500 can reclaim its record. Can breadth catch up? If it does, the current concentration in a handful of leaders could give way to a broader-based advance.
If it does not, traders will have to contend with a market in which the index continues to look stronger than the average stock underneath it.
The next record high may therefore tell traders less about where the S&P 500 is going than about how many stocks are actually helping it get there.