
The Nasdaq Composite has already broken into record territory, but the S&P 500 is still trying to clear its own high, highlighting a gap in momentum between technology-heavy stocks and the broader market.
The Nasdaq closed at a record 27,122.09 on Monday after gaining 2.3%, while the S&P 500 rose 1.5% to 7,764.70, leaving it just 0.44% below its record close of 7,798.99 from Aug. 13 and 0.67% off its intraday peak of 7,816.70 reached in the same session. The contrast puts the spotlight on whether the S&P 500 can extend the rally beyond the technology and artificial intelligence (AI) names that have driven the latest advance.
What’s Behind Nasdaq’s Outperformance
The Nasdaq's record reflects renewed strength in technology and semiconductor stocks. The Philadelphia Semiconductor Index (SOX) jumped 4.3% on Monday, while several major AI-linked stocks posted much larger gains.
The S&P 500 participated in the rally, but its gain was less pronounced. That matters because the index has a much broader sector composition than the Nasdaq. A sustained move to a new high therefore requires more than another surge in a handful of technology leaders.
Tuesday's trading reinforced that distinction. The Nasdaq reached an intraday record of 27,272.72, while the S&P 500 remained close to its record but had yet to establish a comparable breakout.
Breadth Is the Key Question
One reason the S&P 500 is struggling to decisively clear its record is the uneven participation beneath the headline index.
The latest rally has been heavily influenced by large technology and AI-related companies, with nearly 59% of S&P 500 stocks still at least 20% below their individual highs even as the index approached its own record.
That does not necessarily prevent the index from making a new high because the S&P 500 is market-cap weighted. However, it does mean the broader market is not moving uniformly.
For traders, the distinction is important: a new S&P 500 record driven by broader sector participation would represent a different market signal from a record driven primarily by a narrow group of megacap technology stocks.
Falling Oil and Yields Are Helping
The macro backdrop has recently become more supportive for equities.
West Texas Intermediate (WTI) crude, the U.S. benchmark, is down for the fifth straight session, easing some of the inflation pressure that had weighed on markets. At the same time, the 10-year Treasury yield moved back below 5%, helping reduce the pressure on equity valuations.
The combination is important because higher oil prices can reinforce inflation concerns and push bond yields higher, creating a tougher environment for stocks. The recent reversal in both markets has therefore given equities some breathing room.
But that support could prove temporary if oil reverses higher or Treasury yields resume their climb.
The Fed Still Limits the Backdrop
The equity rally is also taking place against a less accommodative monetary-policy backdrop.
The Federal Reserve raised its policy rate by 25 basis points last week to 3.75%-4%. That means the latest Nasdaq breakout cannot simply be attributed to expectations of easier monetary policy.
Instead, investors have been willing to look through higher rates as enthusiasm around AI spending and technology earnings has returned, while falling oil prices have eased some of the inflation concerns surrounding the broader market.
This creates a more complicated setup for the S&P 500. The index is close to a record, but it is approaching that level while monetary policy remains restrictive.
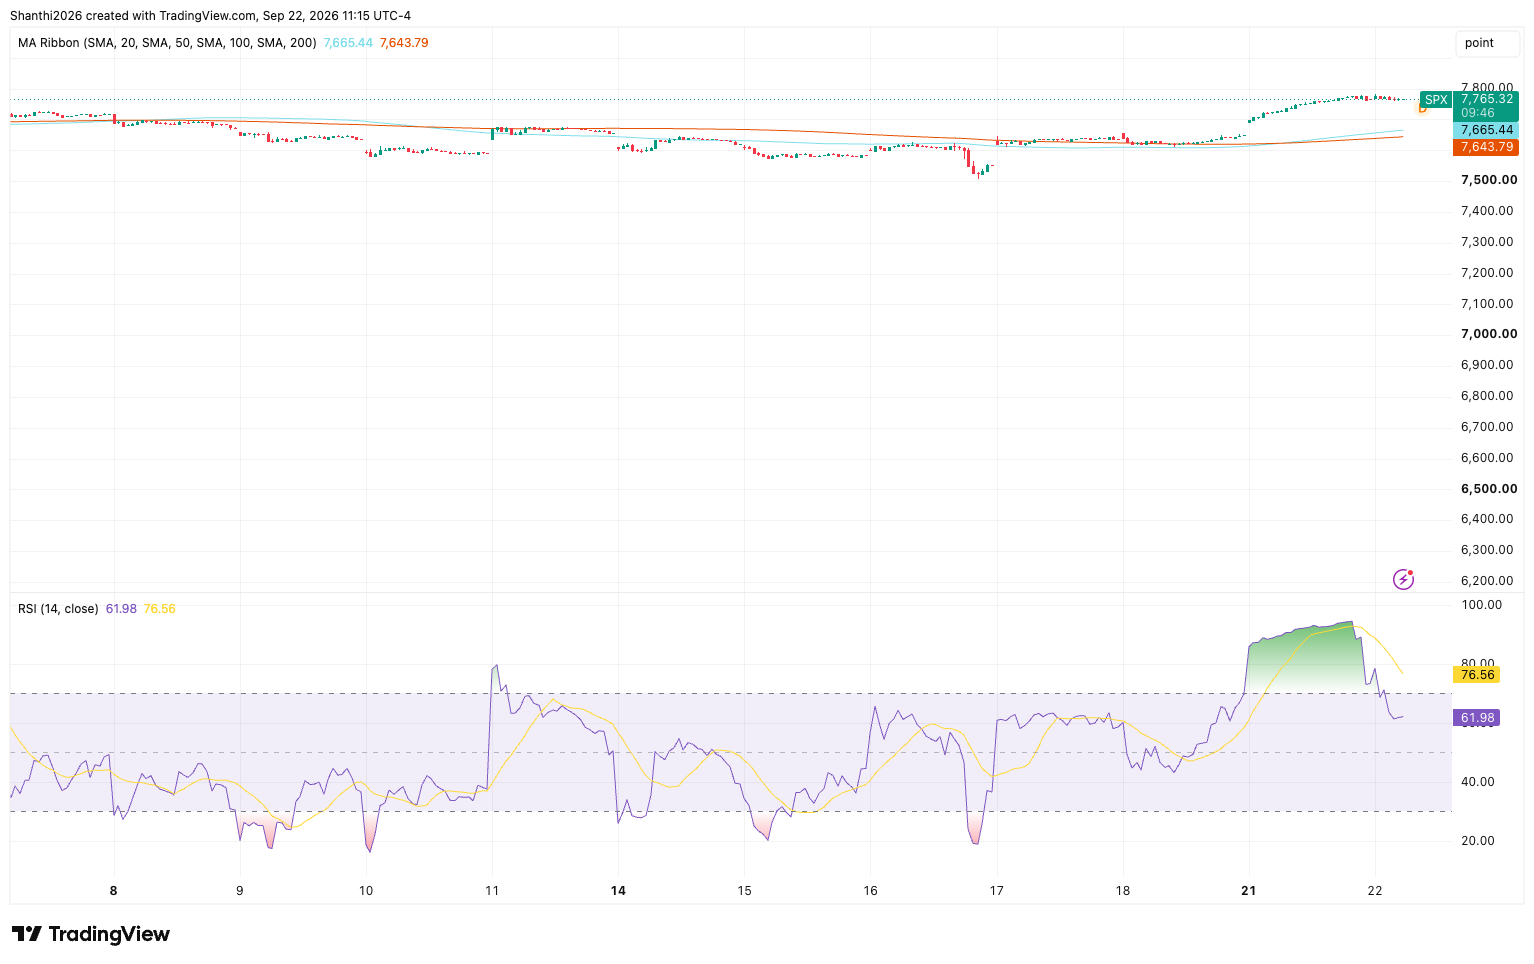
Momentum Cools Across M15 and H1 Charts as S&P 500 Tests Highs
The S&P 500 remains firmly supported across the 15-minute, hourly, and daily timeframes, with price holding above key moving averages and trading near recent record highs. However, momentum is beginning to moderate on shorter-term charts. The M15 RSI has retreated from overbought territory, while the hourly RSI has also eased after reaching elevated levels, suggesting the latest rally may be losing some steam.
Source: TradingView
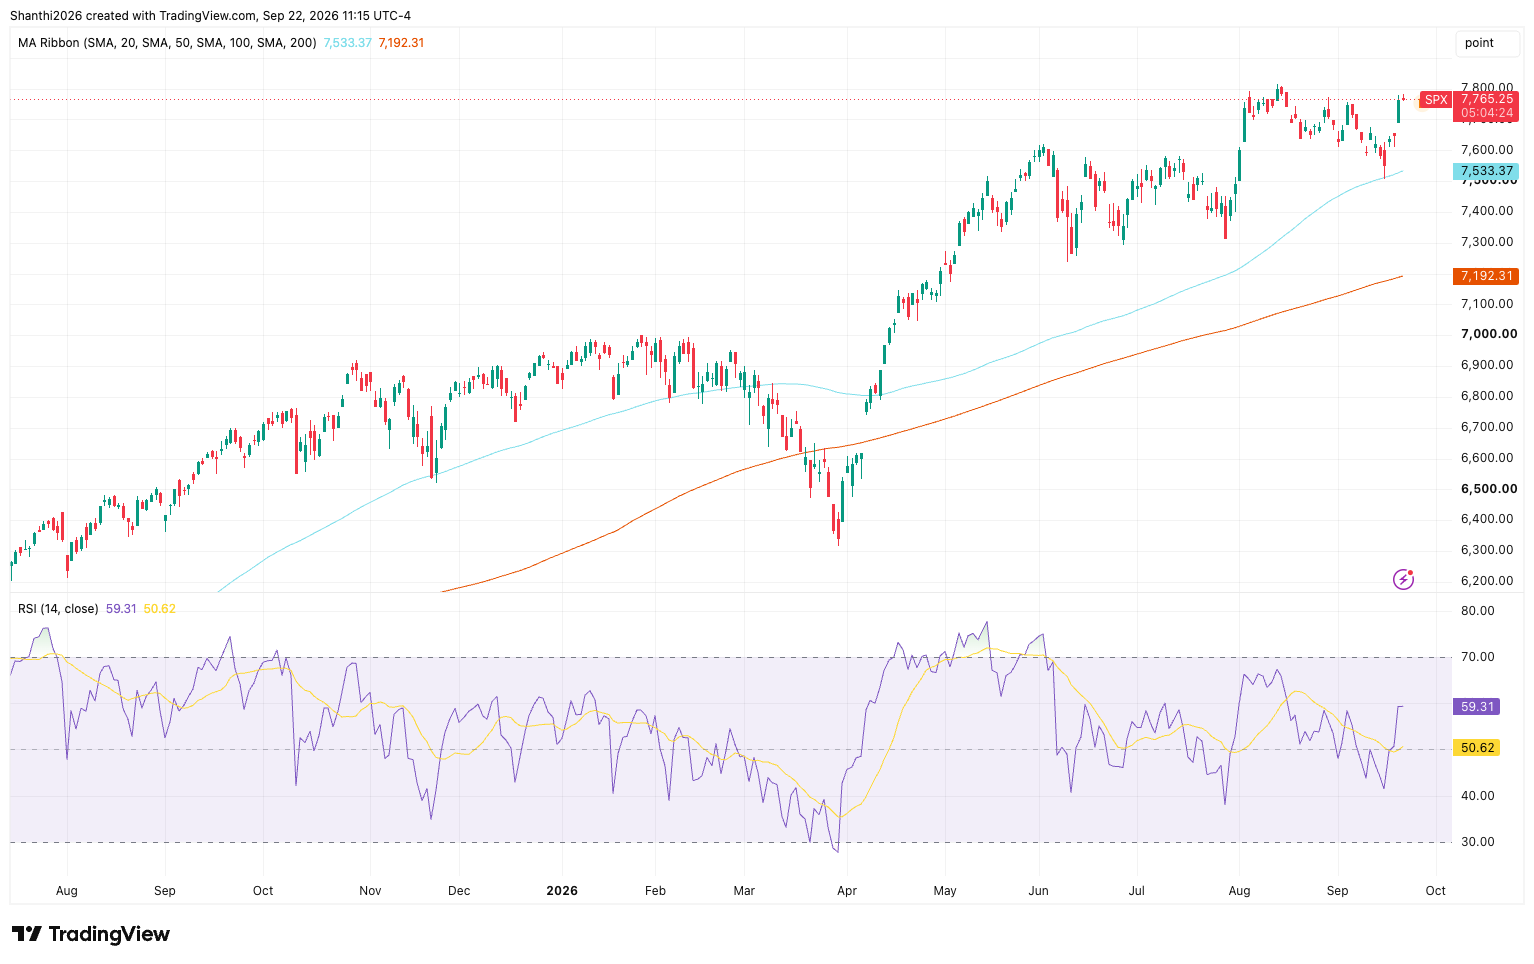
The broader trend remains constructive, with the daily chart continuing to show higher highs and higher lows above major moving averages. Even so, the daily RSI remains in overbought territory, indicating the market is becoming increasingly stretched.
Source: TradingView
Taken together, the multi-timeframe picture favors the bulls, but near-term conditions point to a higher probability of consolidation or sideways digestion before the index attempts another sustained move higher.
Futures traders’ positioning in ES futures now shows a clear split between skill cohorts, MarketFramework’s Positioning Edge tool shows profitable traders are 62% long compared to unprofitable traders, who are 38% long. Historically, a gap as this (24-point divergence) favors continuation rather than reversal, since the weaker-positioned group may eventually be forced to forced to cover shorts or chase longs, adding upside pressure.
What Needs to Happen for the S&P 500 to Break Higher?
The immediate technical test is straightforward: the S&P 500 needs to clear the 7,798.99 record close and establish acceptance above that level.
A sustained move above the record would put the index into price discovery and shift attention toward how far the broader rally can extend.
The more important confirmation, however, would come from participation. Continued strength in technology could push the index through resistance, but broader gains across sectors would make the move more representative of overall market strength.
Conversely, repeated failure near the record while leadership remains concentrated could leave the index vulnerable to consolidation.
Morgan Stanley Equity Strategist Michael Wilson, however, highlighted earnings as a bright spot, helping prevent further damage.
Specifically, median stock EPS growth is in the mid-teens, and revisions breadth for the high quality S&P 500 is back near cycle highs, helping explain why the index price damage has been contained.
The strategist flagged near-term risks that could drag the index down to 7,000-7,100 but expressed confidence regarding a recovery that could help the index hit Morgan Stanley’s year-end target of 8,000. The near-term risks that could play out over the next three to five weeks are higher crude and refined product prices, along with the historical trading patterns heading into mid-term elections.
Near-Term Outlook
The Nasdaq's record has removed one major obstacle for the broader equity rally, but the S&P 500 now faces a different test: can the strength in technology spread across the wider market?
For now, falling oil prices and lower Treasury yields are providing a favorable backdrop, while AI and semiconductor momentum continue to support the growth-heavy side of the market.
The next few sessions should therefore offer a clearer read on whether the S&P 500's proximity to its record develops into a broad-based breakout or another test of resistance. The Nasdaq has already made its move. The S&P 500 still needs to prove that the broader market can follow.