
Risk appetite is running hot after an AI-powered rally. In Mondays U.S. session the S&P 500 rose 1.5% for its best day since 4 August, and the Nasdaq jumped 2.3% to close just shy of the 31,000 handle.
The leadership was narrow and loud: Meta rose more than 11%, Intel around 12%, AMD roughly 10% as it touched a $1 trillion market cap, and Corning almost 6%.
Overnight, Alibaba added about 3% in Hong Kong on a new AI chip and a large data-centre buildout.
This morning, futures are little changed to slightly softer (NQ down about 0.2%), a normal digestion pause after a big move.
The week's real swing factor is the Trump–Xi summit in Washington, with AI, tariffs, rare earths and the Iran war on the table; traders also get the Richmond Fed manufacturing survey and remarks from the Fed's Williams and Barkin today.
Net read: constructive, but pausing at the highs.
The Big Picture (H4): The Breakout Is Real and Stretched
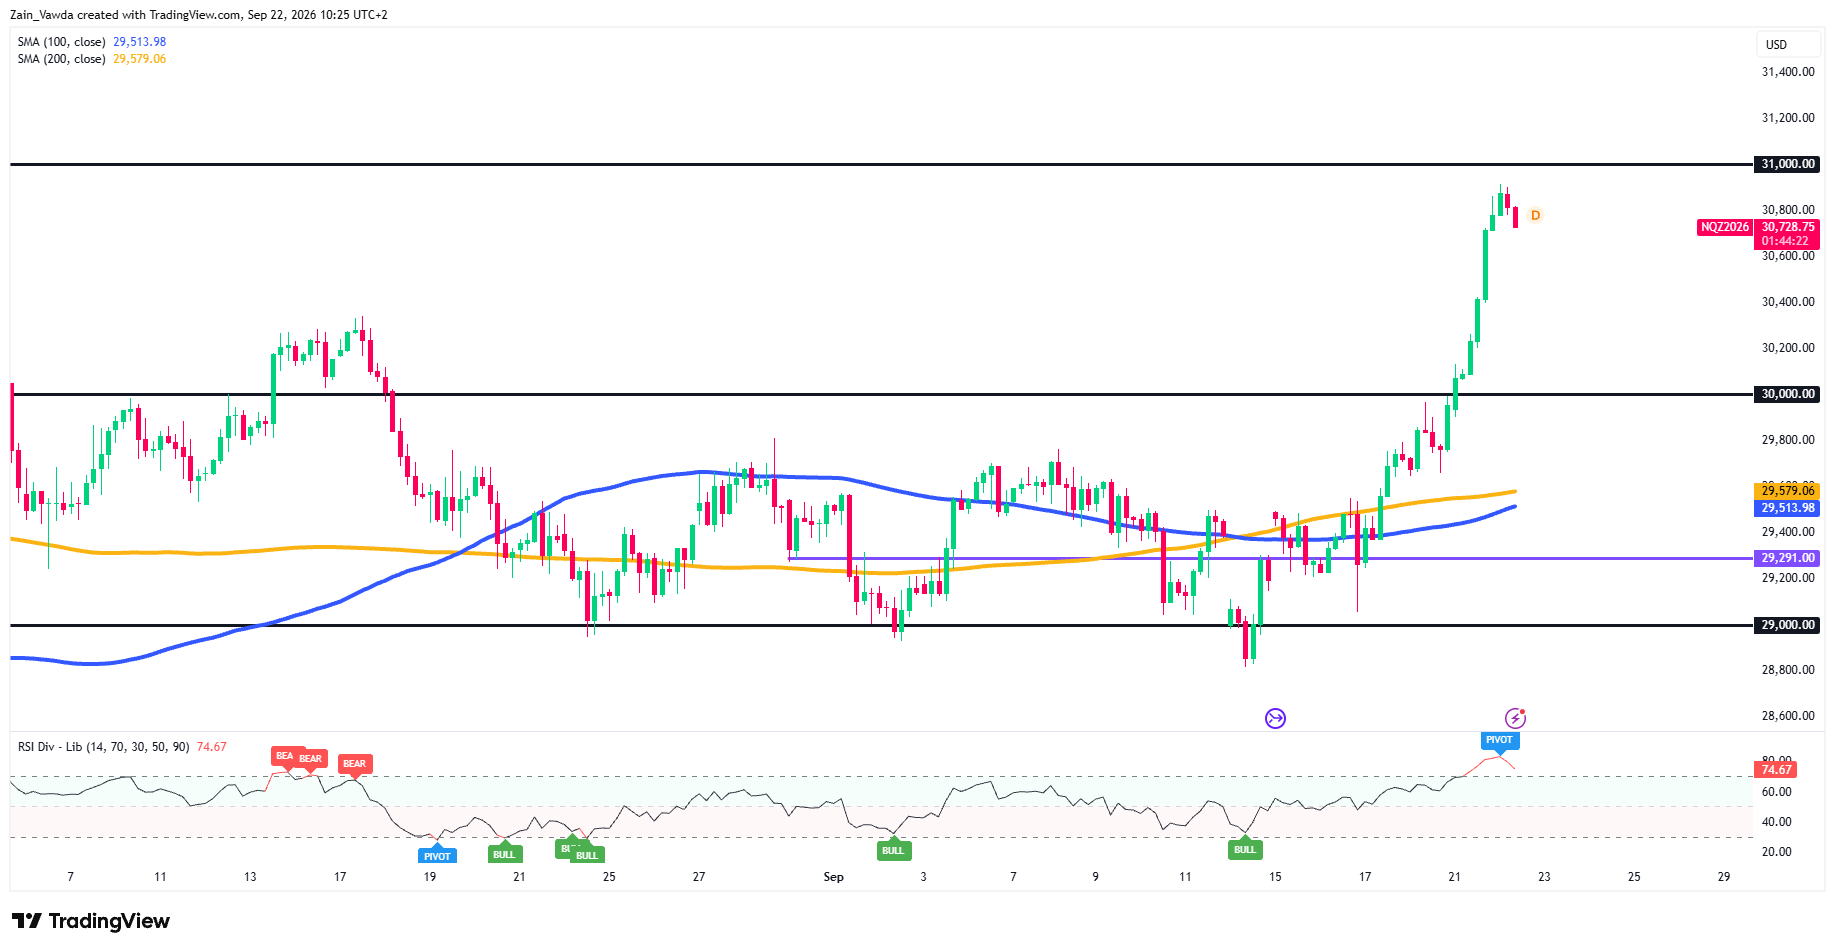
On the 4-hour chart NQ has broken cleanly out of the 29,000–30,000 range that boxed it in through most of September, ripping up to a high near 30,900 and now trading around 30,725.
Price sits far above both moving averages, the 100-MA near 29,510 and the 200-MA near 29,580 (a moving average is just the average price over the last X bars, used as a trend guide).
Nasdaq (NQ) Four-Hour Chart, September 22, 2026
Source: TradingView
That distance tells you the trend is strongly up, but also that price is a long way from its "value", a stretched rubber band.
The momentum gauge (RSI) is at 74.67, in overbought territory, and the divergence tool has printed a pivot flag near the top, an early warning that upside momentum may be peaking, not that the trend has turned.
Zooming In (H1): New Highs, Then a Stall Near 30,900
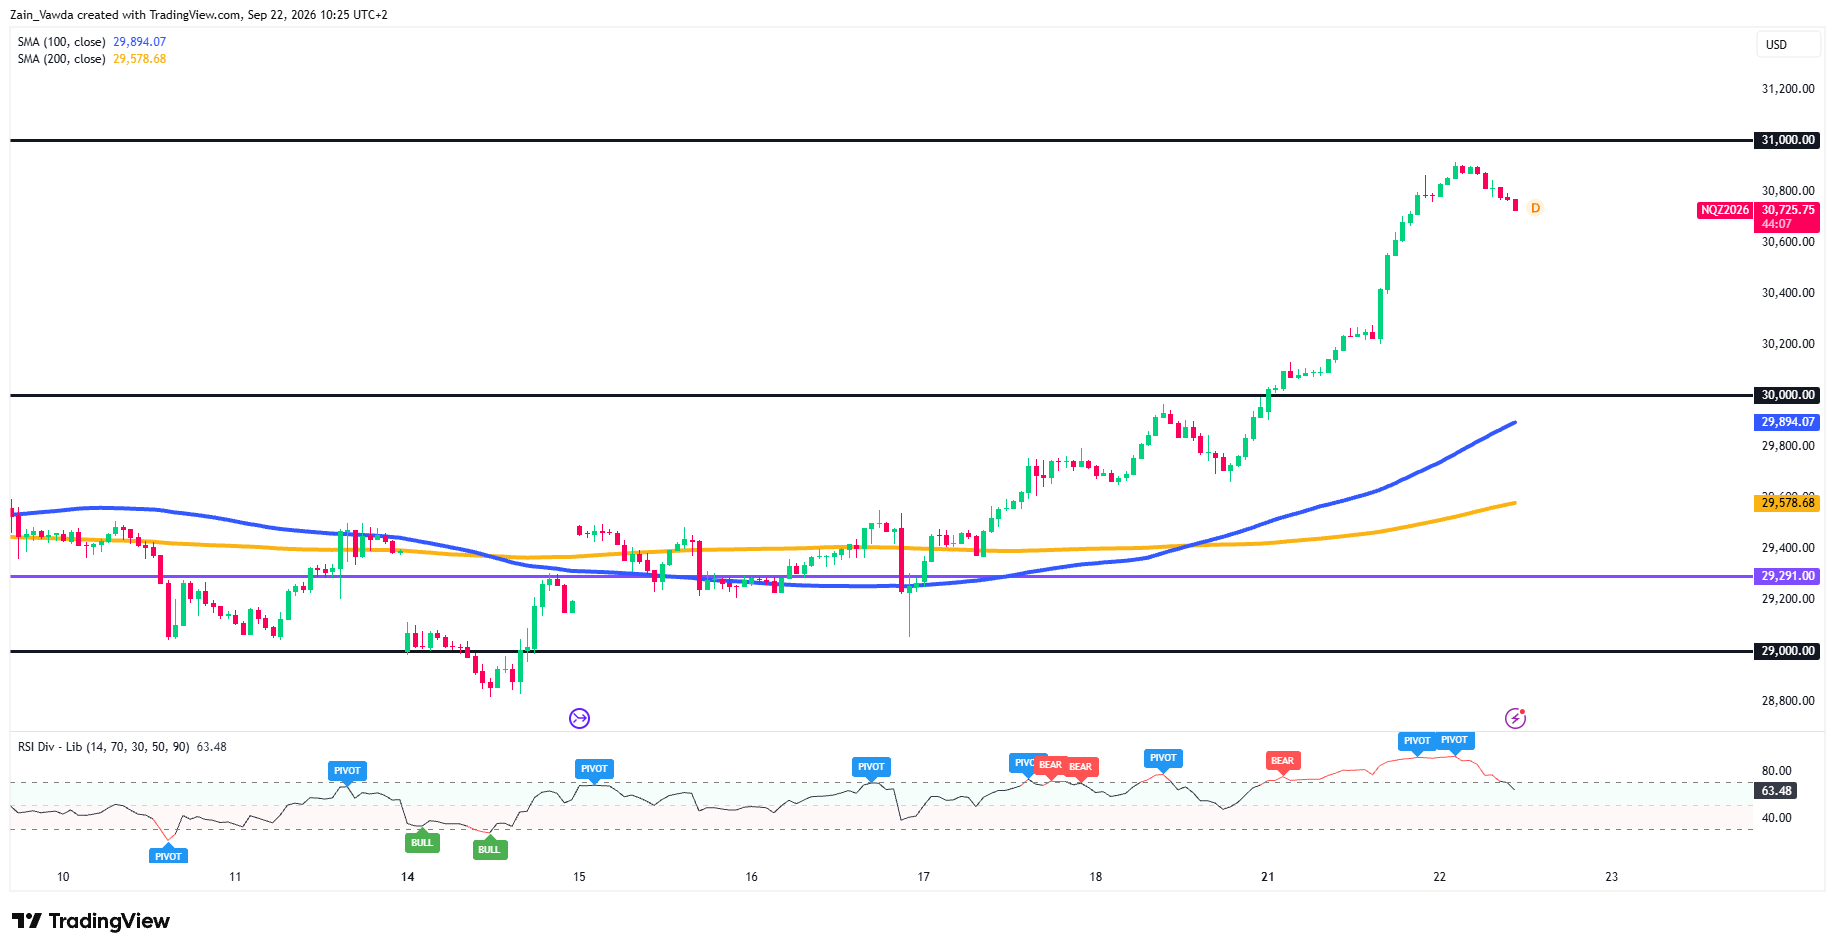
The hourly chart shows the same story with more detail: a break above 30,000 around 21 September, a push to roughly 30,900, and now a modest pullback.
The moving averages are stacked bullishly (fast above slow, both rising) beneath price at about 29,894 and 29,578, so the intermediate trend is intact.
Nasdaq (NQ) One-Hour Chart, September 22, 2026
Source: TradingView
RSI has cooled from overbought to 63.48, and the pivot flags at the recent highs point to a near-term stall.
First support is 30,300 before the psychological 30,000 level, the spot NQ needs to hold as a floor on any retest.
The Near Term (M15): Profit-Taking Bites, RSI oversold
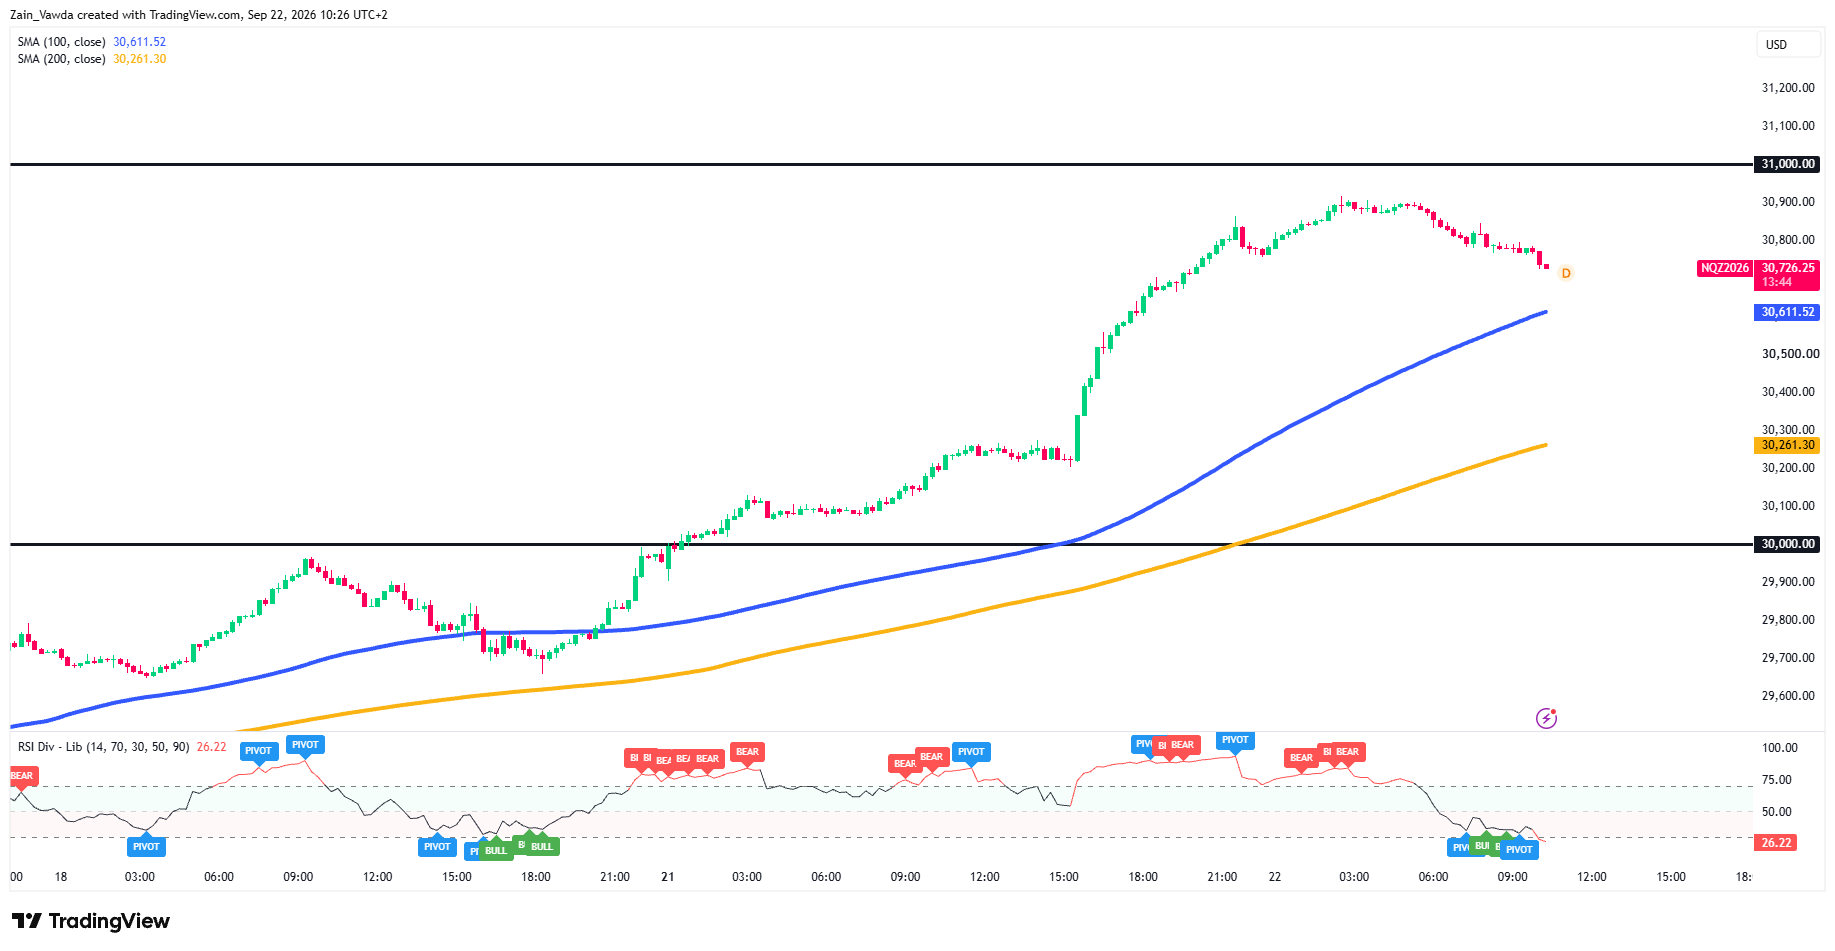
On the 15-minute chart the vertical run topped out near 30,900 in the early hours and has rolled over into lower highs, with the divergence tool tagging bearish flags on the way down.
Nasdaq (NQ) M15 Chart, September 22, 2026
Source: TradingView
Price is now resting on its near-term shelf: the 100-MA at about 30,611 with the 200-MA below at 30,261.
RSI has dropped to 26.22, oversold and printed a fresh bullish pivot flag near the low, which says the immediate down-leg is stretched and a bounce or pause is due.
In short: the higher timeframes are strong but overbought; the lower timeframe is working off froth.
Bull / Base / Bear (Matrix Keyed to the Trump–Xi Summit and the 31,000 Test)
| Scenario | Trigger |
|---|---|
| Bull | A constructive summit tone (progress on trade, AI or rare earths) plus a clean break and hold above 31,000 opens continuation to new highs; dips into the 30,600–30,260 shelf get bought. |
| Base | The summit gives no clear steer and NQ chops between 30,000 and 31,000, digesting the overbought reading. Play the range edges, not the middle. |
| Bear | The summit disappoints or tensions flare (tariffs, Iran, rare earths), or 30,000 gives way, a deeper reset toward the 29,291 pivot. The larger uptrend only comes into question if 29,000 breaks. |
Trader Positioning Data
The Positioning Edge Tool on MarketFramework leans bullish.
On the 4-hour view, profitable traders have pushed their long share up to about 70–72%, while unprofitable traders have cut theirs to roughly 28–43%, leaving the winning cohort around 28 points more long than the losing one.
The tool flags this gap as an "extreme bullish divergence": the traders who tend to be right are building longs just as the crowd fades the move. Both groups share almost the same average long entry near 30,734, a touch below the 30,765 print, so longs sit marginally onside.
The takeaway: this supports the idea of potentially buying dips into support rather than fading the rally, though the thin entry cushion means the edge can flip quickly.