The Setup: A Relief Bounce that’s Fading Before Lunch
Wednesday was rough. After the Fed’s first rate hike since 2023, Chair Kevin Warsh warned that inflation still hasn’t “meaningfully improved,” and stocks threw away solid early gains: the Dow closed down 1.2% at 51,462 and the S&P 500 slipped 0.45% to 7,552.
Thursday opened on the front foot, Treasury yields eased back below 5%, oil fell (U.S. crude near $100), and big tech led, so the cash Dow opened up about 0.8% and the S&P about 1.2%.
But the futures screen tells the real-time story the opening headlines can’t. Within the first half-hour of the New York session, both the S&P 500 (ES) and Dow (YM) futures were already handing that opening pop back.
This is a bounce being sold, not bought at this stage and, as the charts show, the Dow is leading the way down.
S&P 500 (ES): Resilient, but Momentum is Tiring
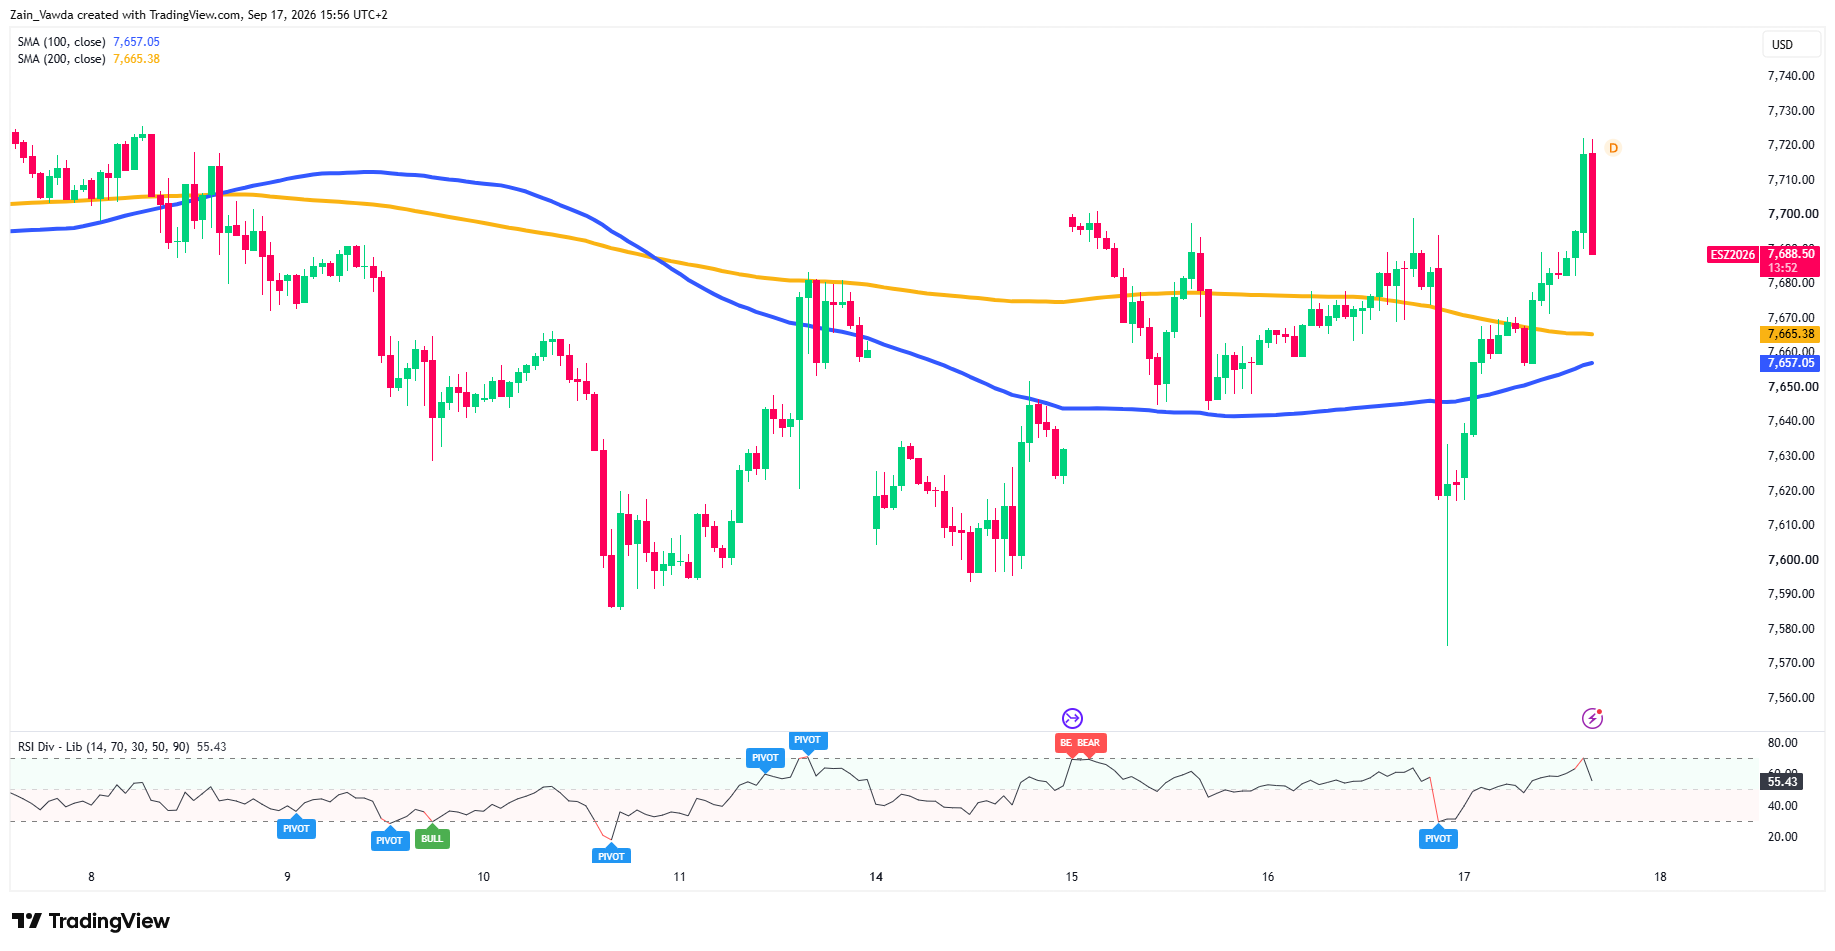
On both the 1-hour and 15-minute charts, ES pushed up to a session high near 7,720– 7,725 after the open, then eased back toward ~7,690.
S&P 500 (ES) One-Hour Chart, September 17, 2026
Source: TradingView
The pullback came with bearish RSI divergence, price made a higher high while momentum made a lower one, a classic sign the push was running out of buyers.
The line that matters is the 7,657– 7,669 shelf, where the 100- and 200-period averages sit almost on top of each other.
Hold above it and this is just a normal breather inside an up-tilt; a clean break below opens 7,640, then the Sep-11 low near 7,590 and the FOMC spike low around 7,575.
Dow (YM): Rejected at its Averages, Momentum Flipped Down
The Dow futures is the weaker picture.
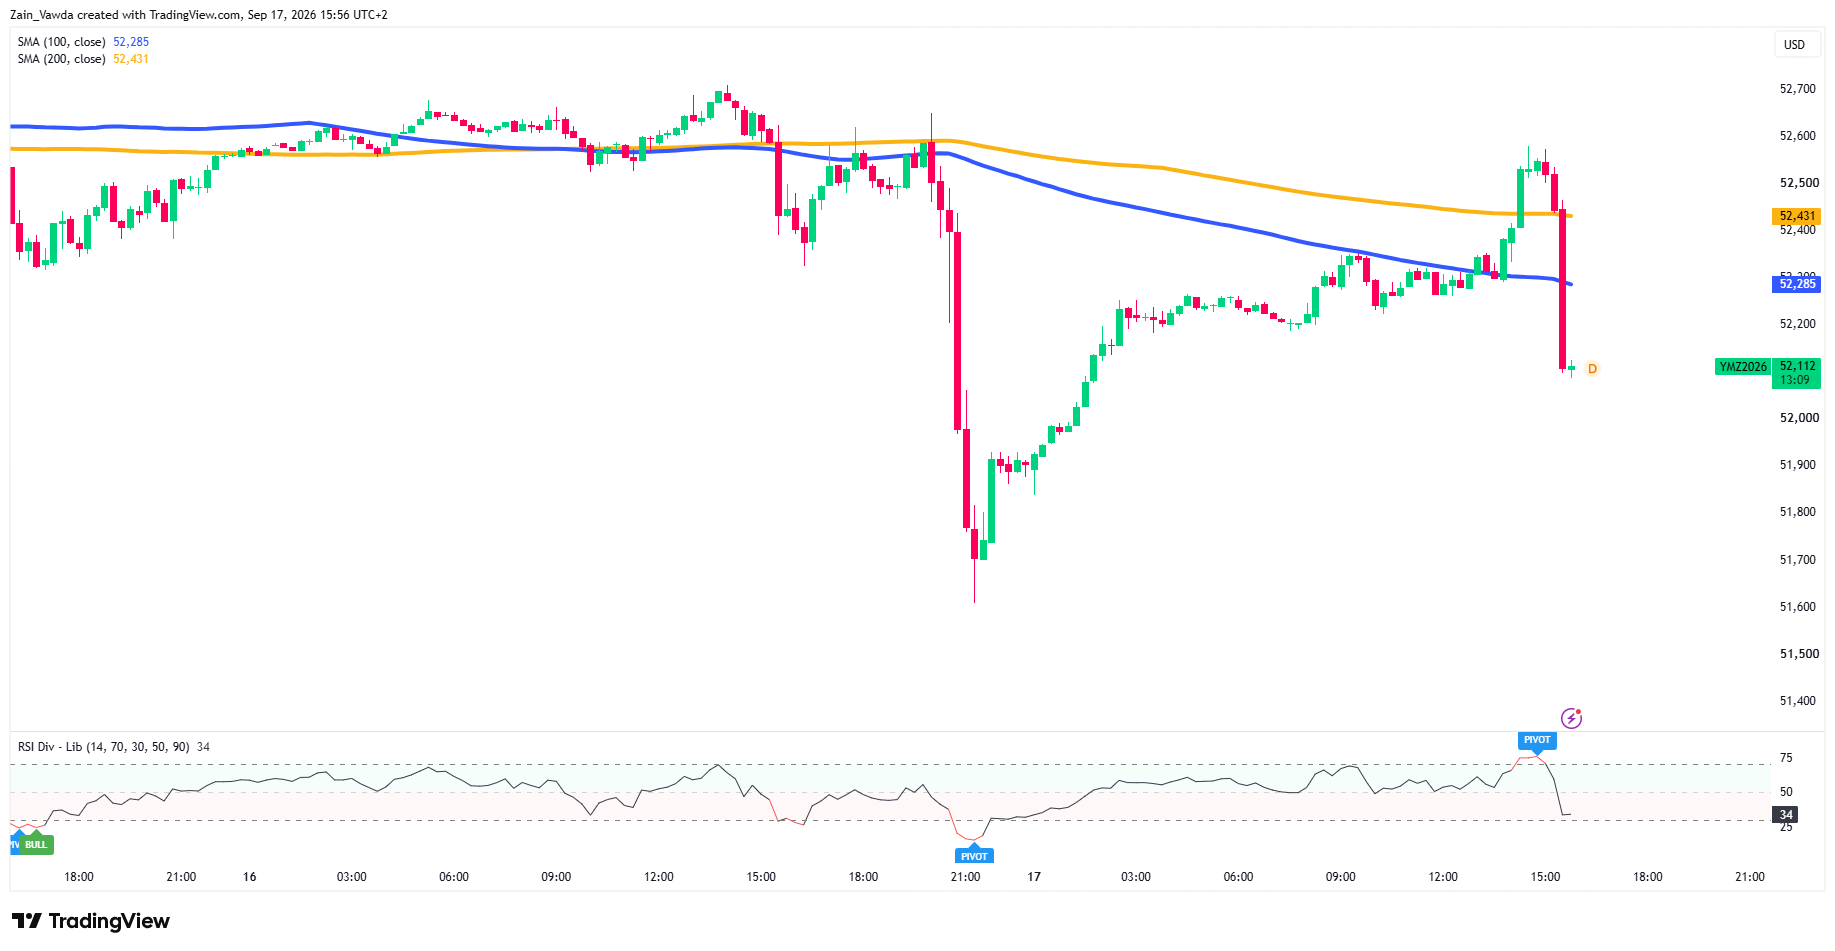
YM rallied into the 52,500– 52,550 area at the open, was rejected right at its falling 100- and 200-period averages (about 52,285 and 52,431 on the 15-minute; 52,490 and 52,629 on the 1-hour), and rolled straight back over to ~52,110.
Momentum agrees: 15-minute RSI collapsed from roughly 75 to 34 in a handful of bars, a sharp, decisive rejection, not a gentle pullback.
Dow Jones (YM) M15 Chart, September 17, 2026
Source: TradingView
Unless YM can reclaim 52,285, the path of least resistance is lower: 52,000 (round number), then the Sep-11 low ~51,950 and the FOMC spike low ~51,620.
The Session Read: What Actually Decides the Afternoon
Two questions settle the US afternoon.
First, does the S&P hold its 7,657– 7,669 shelf?
Second, can the Dow reclaim 52,285? If the S&P holds and the Dow climbs back above that line, the relief bounce is intact and the morning fade was just profit-taking.
If the S&P loses its shelf while the Dow stays heavy, Wednesday’s post-Fed sell-off is simply resuming and with Friday’s quarterly futures-and-options expiry (“quad witching”) on the way, moves can be exaggerated as big positions roll.
The macro backdrop is genuinely mixed: lower yields and lower oil are tailwinds, but Warsh’s “inflation hasn’t meaningfully improved” line and the dot-plot signal of another hike this year keep a lid overhead.
Three Ways the Session Breaks
| Scenario | What It Looks Like and What Drives It |
|---|---|
| Bull | The S&P (ES) holds its 7,657– 7,669 shelf and pushes back through 7,700 toward 7,725; the Dow (YM) reclaims 52,285 and turns up to 52,431. Needs Treasury yields to keep easing, oil to stay soft, and big tech to stay bid. |
| Base | A choppy, two-way session: ES ranges roughly 7,657– 7,720 and YM ranges 52,000– 52,431 as the market digests the hike into Friday’s expiry. The dispersion persists, S&P firmer, Dow heavier, with no clean trend either way. |
| Bear | ES loses 7,657 and follows the Dow lower; YM breaks 52,000 toward 51,950, then the 51,620 FOMC low, and ES slides to 7,590 / 7,575. Trigger: yields turn back up, oil bounces, or a hawkish Fed speaker revives the rate-hike fear. |
S&P 500 Positioning Data
The S&P 500 E-mini futures ($ES) positioning data from MarketFrameworks Positioning Edge Tool is triggering an EXTREME BEARISH DIVERGENCE warning, even as the index advances +1.12% (+85.50 points) to 7,694.00 on a 7% decline in volume.
A sharp 17% positioning gap has emerged, with unprofitable traders heavily buying into the strength at 67% long (average long entry of 7,685.34).
In contrast, profitable traders remain balanced at 50% long and 50% short, strategically establishing short positions at a higher average entry level of 7,702.66.
This dynamic indicates that retail accounts are chasing the move into overhead resistance on fading volume, while smart money uses the upside liquidity to build short exposure, creating heightened risk for a sudden bearish reversal.