Nasdaq 100 futures (NQ) are trading around 29,860–29,890 in the premarket, up about 0.4% and leading the U.S. index futures higher.
That extends Thursday's tech-led bounce, when falling Treasury yields and softer oil turned post-Fed pain into relief.
It also puts price back above the 29,800 zone that capped NQ right after Wednesday's hike, so the level the desk flagged yesterday is now beaten, and the next obvious magnet is the 30,000 round number.
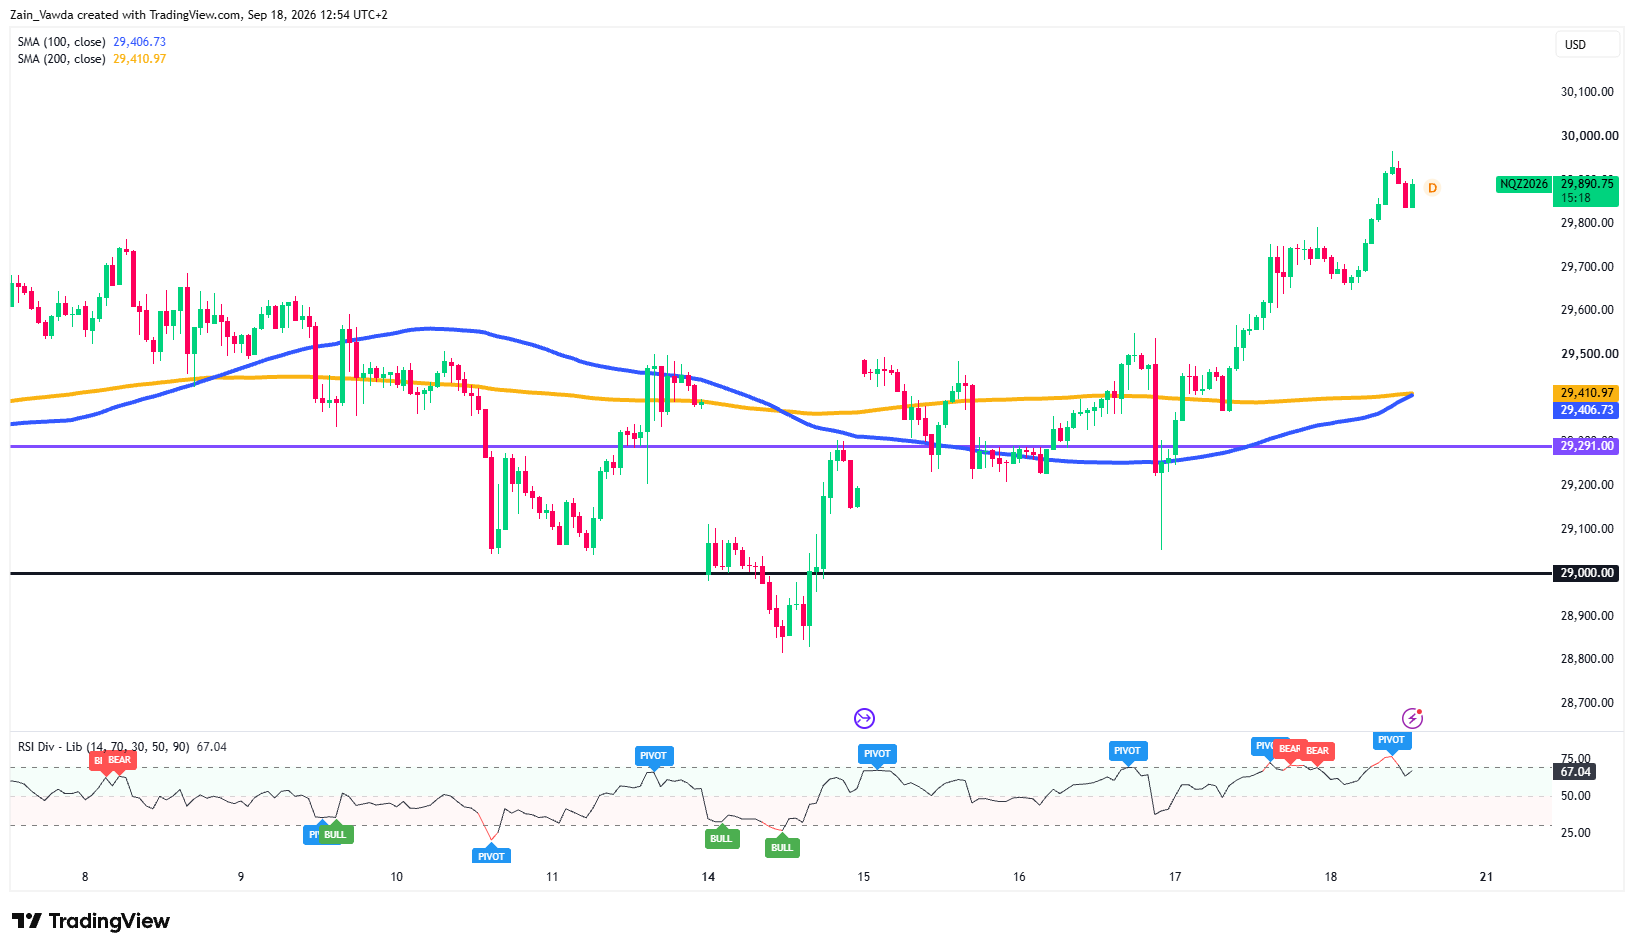
The Bigger Picture (Hourly / H1 Chart)
The hourly trend is firmly up. Price sits well above both the 100-bar and 200-bar simple moving averages, the "SMA" is just the average closing price over the last 100 and 200 period, which traders use as a rough trend line.
Those two averages are bunched together near 29,405–29,410, far below current price, which tells you buyers have had control and the trend has real distance behind it.
NQ has rallied off Monday's low near 28,800 and off the sharp Fed-day spike-low near 29,050, printing a clean run of higher highs.
The one caution: the RSI, a momentum gauge that runs from 0 to 100 is around 67 and showing a bearish divergence at the highs.
In plain terms, price pushed to a new high but the momentum reading did not flash a early sign the current leg is getting tired. It's a warning, not a reversal, but it argues for a possible stall or shallow pullback on the first touch of 30,000 rather than a clean break straight through.
Nasdaq 100 (NQ) One-Hour Chart, September 18, 2026
Source: TradingView
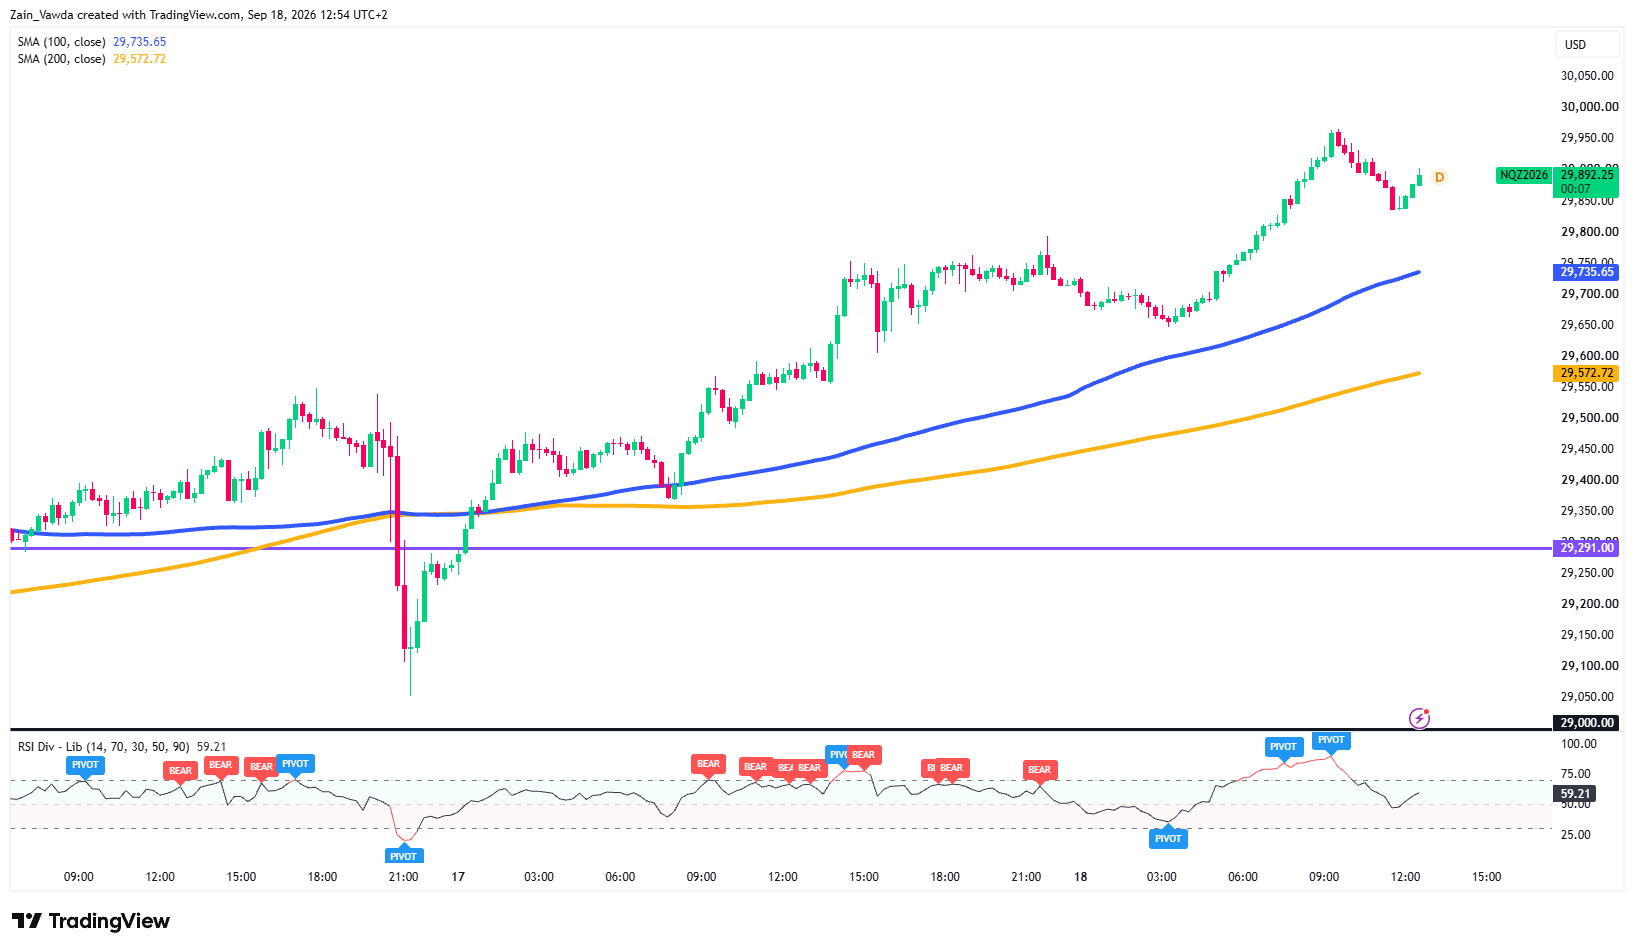
The Near-Term Read (15-Minute / M15 Chart)
Zoom in and the short-term trend is up too. Price is holding above the 15-minute 100-MA (~29,735) and 200-MA (~29,570), both rising and stacked in bullish order (the faster average above the slower one). After tagging a high just under 29,950 overnight,
NQ dipped to roughly 29,820–29,850 and bounced, a healthy, shallow pullback rather than a breakdown.
The 15-minute RSI has cooled to the high-50s from overbought, which leaves a little more room to run before momentum is stretched again.
Nasdaq 100 (NQ) One-Hour Chart, September 18, 2026
Source: TradingView
Levels to watch
- Resistance: 29,950 (overnight high) → 30,000 (major psychological line, likely the day's decision point) → 30,100
- Support: 29,822 (both trader groups' average long entry in Positioning Edge — a behavioural line in the sand) and 29,800 (old resistance, now first support) → 29,735 (15-min 100-SMA) → 29,570 (15-min 200-SMA) → 29,405–29,410 (hourly SMA cluster, the deeper trend floor) → 29,291 shelf, just above the recurring 29,264.75 desk pivot → 29,000
Into the US Session
Nearest catalysts: Conference Board Leading Economic Index at 10:00 a.m. ET, August industrial production, and Fed Governor Michelle Bowman (voter) and Kansas City President Jeffrey Schmid (non-voter):
- Bull: NQ holds above 29,800/29,822 and pushes through 30,000 on a soft LEI print or dovish-leaning Fed commentary → opens 30,100+.
- Base: NQ chops between 29,800 support and the 29,950–30,000 ceiling; the round number caps the first attempt given the hourly momentum warning, and buyers defend the ~29,735 average.
- Bear: A hawkish Fed-speaker headline or a hot data print that shoves the 10-year yield through the 5% line (it's ~4.96% now, knocks NQ back below 29,800/29,822 → 29,735 → 29,570, with the 29,405–29,410 hourly floor the line that keeps the larger uptrend intact.