
U.S. index futures are edging higher ahead of Friday’s open, but the Nasdaq and the Dow are telling very different stories. Nasdaq 100 futures (NQ) are up about 0.5% near 30,960, pressing on 31,000 again. Dow futures (YM) are up about 0.2% near 51,885, but that is a bounce inside a downtrend.
The Dow is heading for a fourth straight losing week, down 0.6% through Thursday, while the Nasdaq is up 1.6% week to date.
As our U.S. premarket report explained, the bond market is still in charge. The 10-year Treasury yield climbed to 5.225% late Thursday, its highest since 2007, and the 30-year hit 5.502%. Hawkish comments from Fed Governor Michael Barr, high energy prices tied to the Iran war and a hot PMI report pushed yields up. Futures now price roughly a 68% chance of a rate hike in October, according to the CME FedWatch tool.
Higher borrowing costs hit the real economy directly. The 30-year mortgage rate is up to 7.45%, and Morgan Stanley expects rising rates to slow consumer spending next year. That matters more for the Dow, which leans on consumer, industrial and financial names, than for the Nasdaq.
Today’s data includes durable goods orders at 8:30 a.m. ET and the University of Michigan consumer sentiment report at 10:00 a.m. ET.
Dow Futures One-Hour Chart: Bouncing Into a Downtrend
Dow Jones Futures One-Hour Chart, September 25, 2026
Source: TradingView
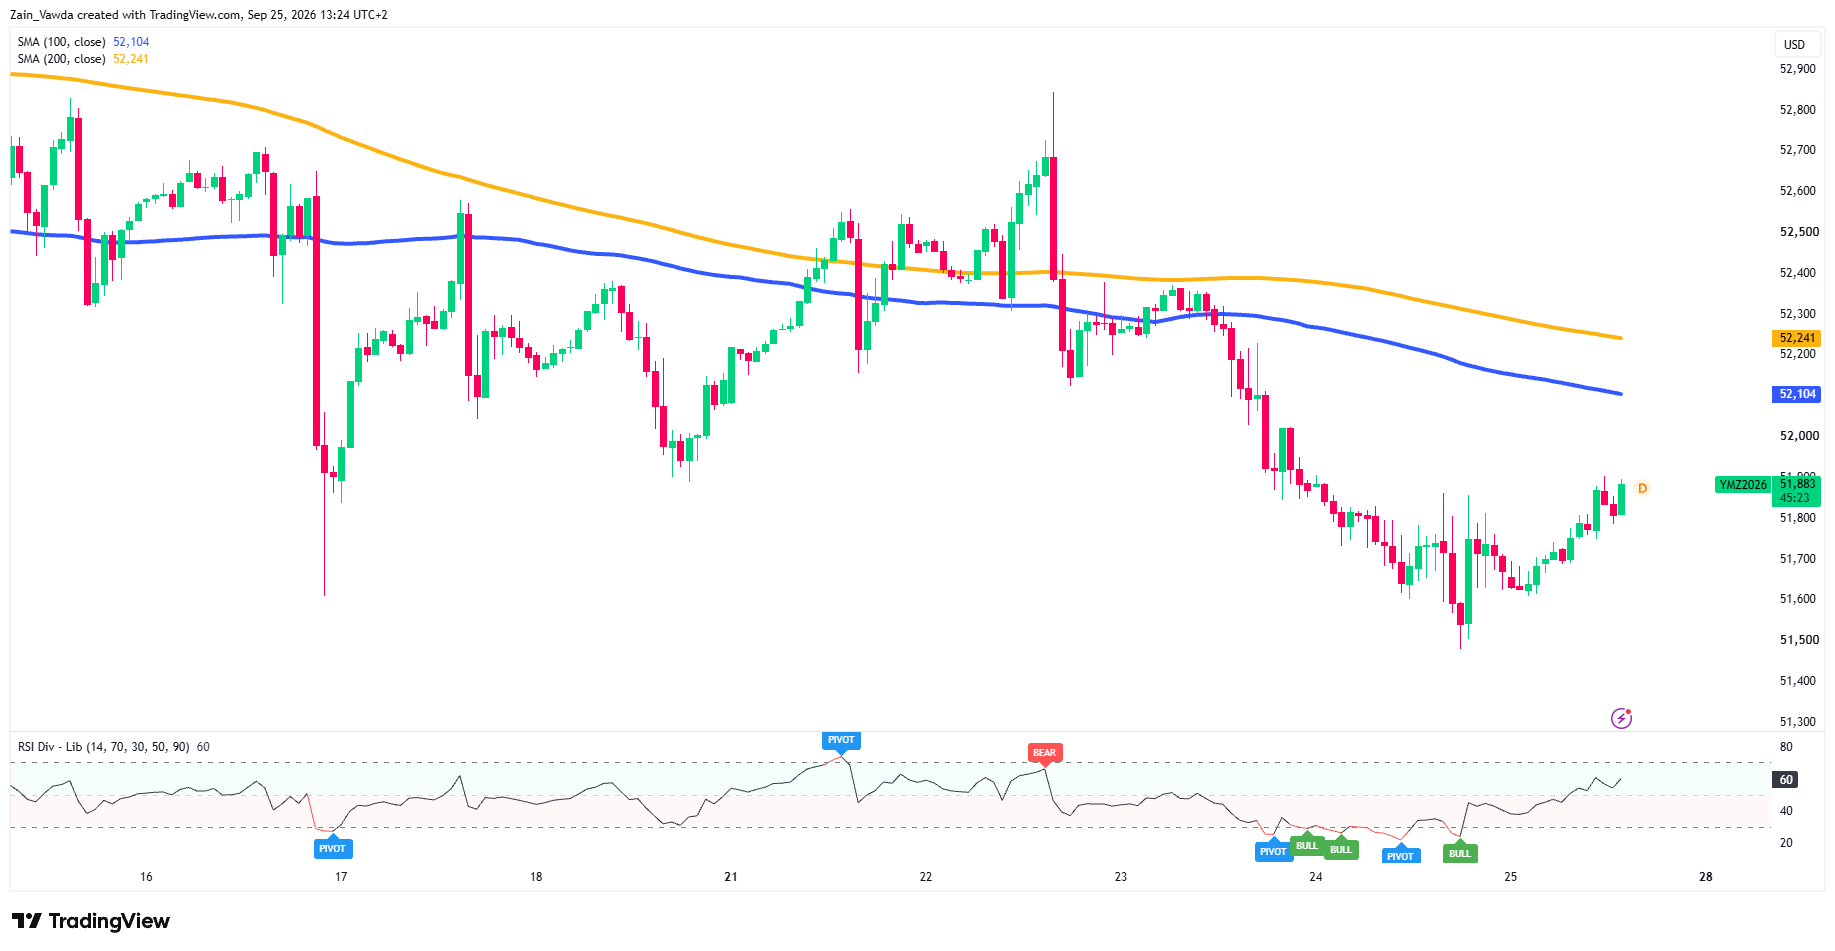
The bigger picture for YM is still bearish. Since the sharp rejection near 52,800 on Monday, price has made lower highs and lower lows, bottoming near 51,480 on Thursday.
Both the 100-period moving average (52,104) and the 200-period (52,241) are sloping down, with price below both. That is the classic look of a downtrend.
RSI flagged bullish divergence at Thursday’s lows and has now climbed to about 60, so the bounce has some real momentum.
The first tests are the 52,000 round number and then the 100-hour average at 52,104.
Dow Futures 15-Minute Chart: Buyers Take Back the 200-SMA
Dow Jones Futures 15M Chart, September 25, 2026
Source: TradingView
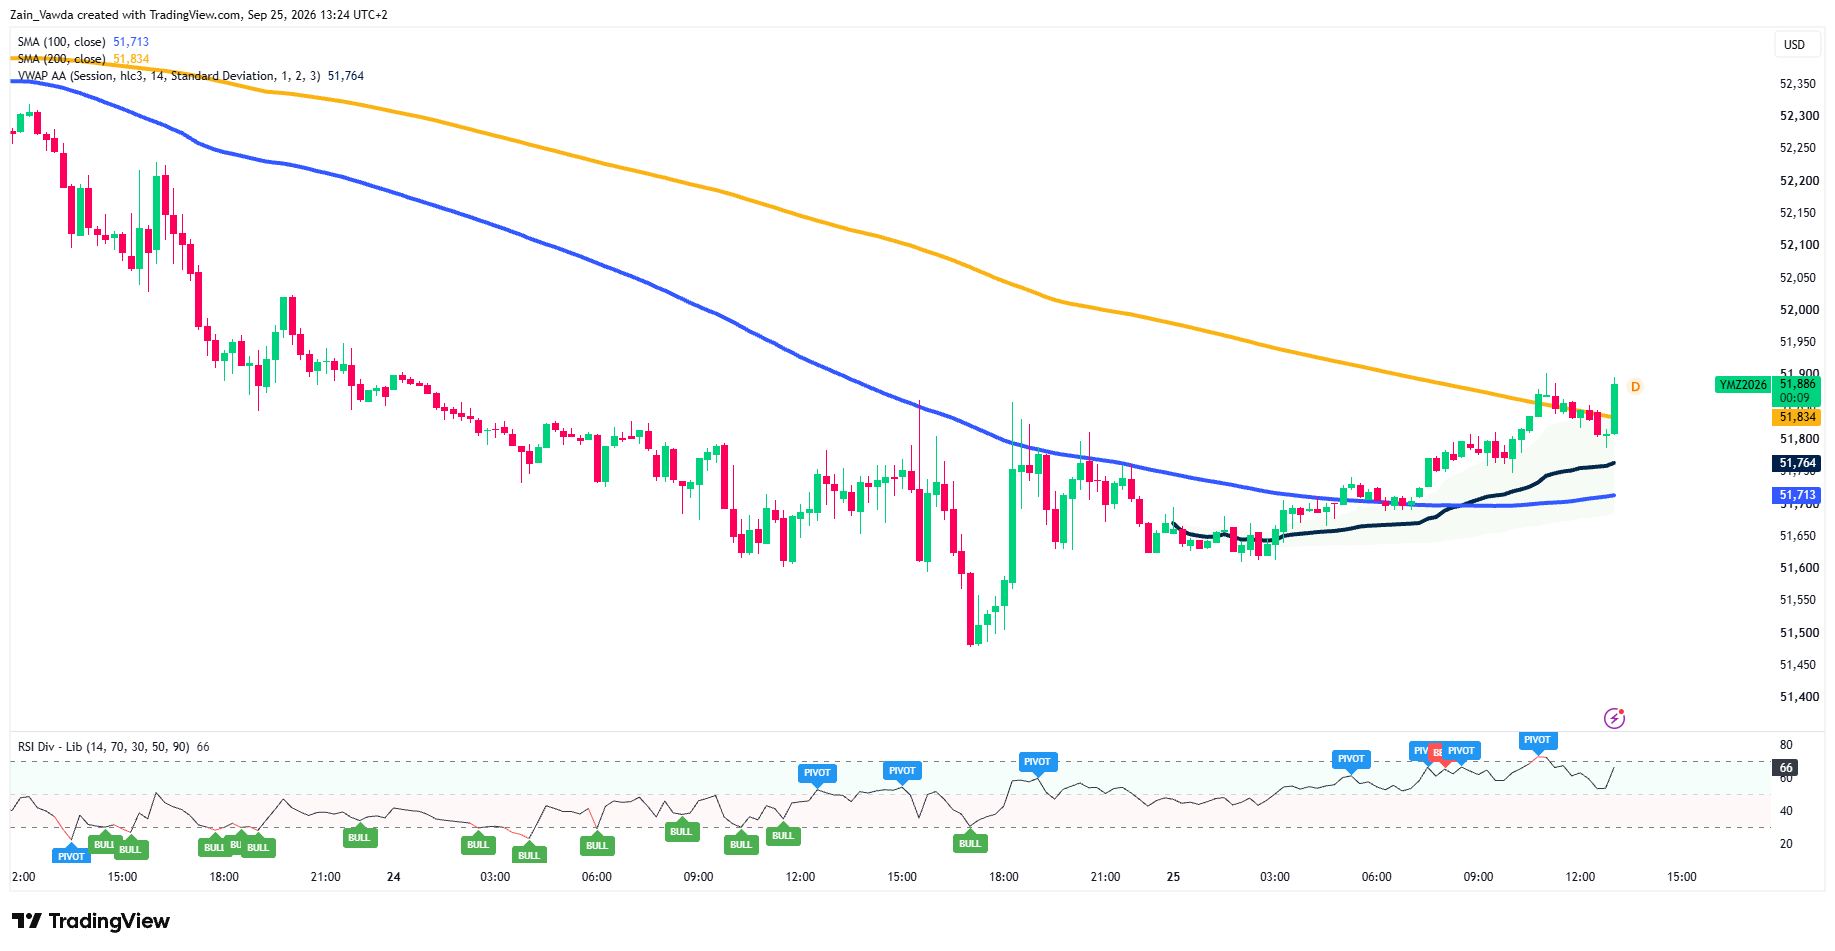
On the 15-minute (M15) chart, buyers have the edge. Price has pushed back above the 200-period moving average at 51,834 after a brief dip under it, and it sits above the 100-period (51,713) and the session VWAP at 51,764. VWAP is the average price paid today.
The morning high near 51,910 is the immediate ceiling. RSI is around 66, close to overbought, so a stall there would not be a surprise.
Holding 51,834 keeps buyers in control; a slip below VWAP hands it back to sellers.
Nasdaq 100 One-Hour Chart: Back at the Record Door
Nasdaq 100 Futures One-Hour Chart, September 25, 2026
Source: TradingView
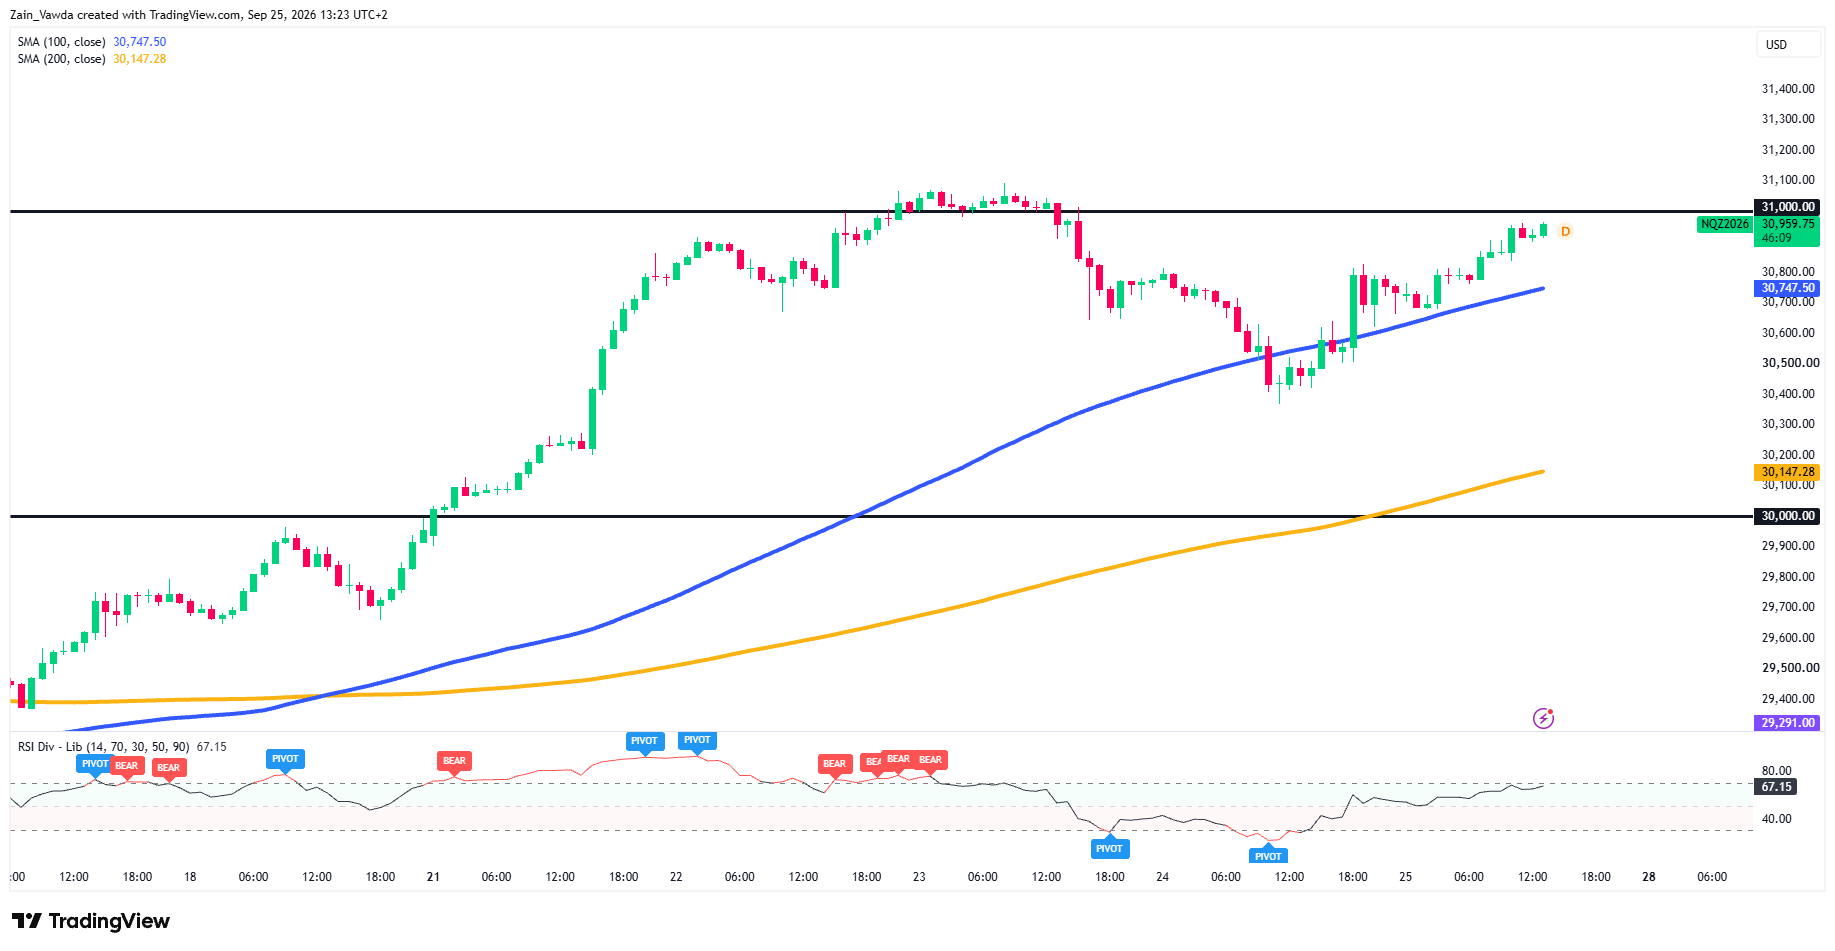
NQ’s structure is much healthier. The uptrend is intact, with the 100-hour moving average (30,747.50) well above the 200-period (30,147.28) and both rising. Thursday’s dip to around 30,370 was bought quickly, and price is now back just under 31,000, the level that capped the rally earlier this week near the record high around 31,090.
RSI is about 67, strong but not overbought.
The catch: the last push to the highs printed several bearish divergence signals, meaning buying was fading into the top.
An hourly close above 31,000 would clear the way to fresh records. The 100-period average at 30,747 is the first real support.
Nasdaq 100 15-Minute Chart: Stretched Under 31,000
Nasdaq 100 Futures M15 Chart, September 25, 2026
Source: TradingView
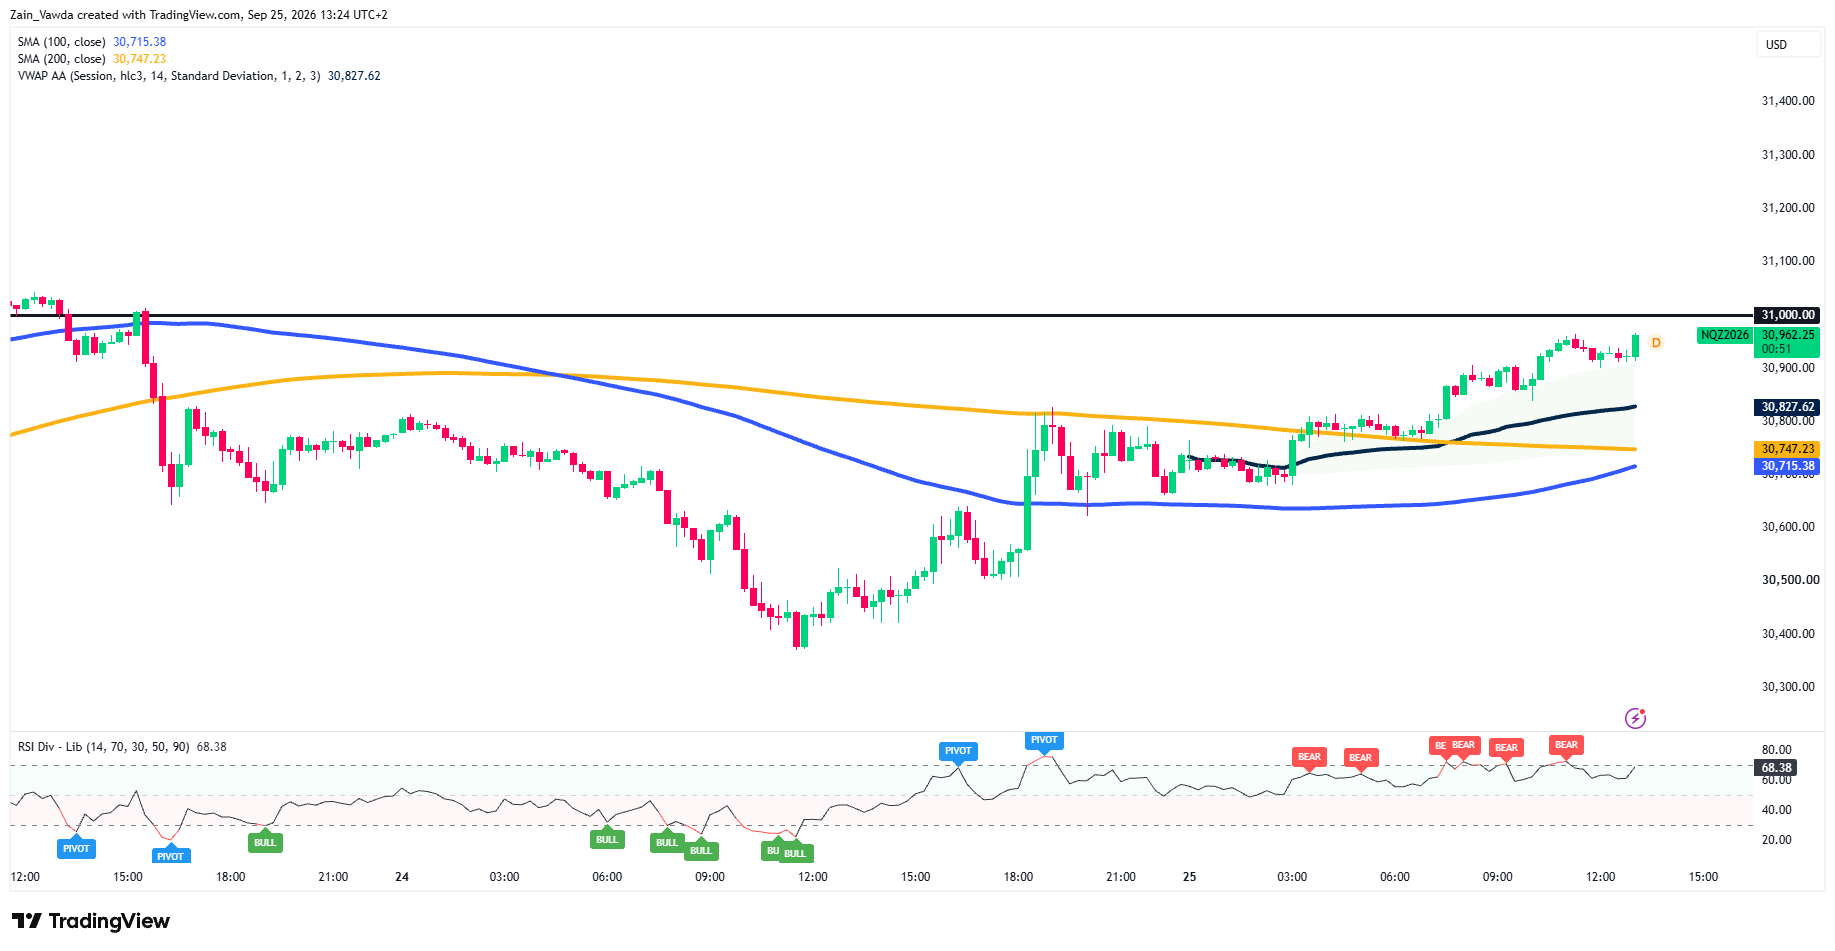
On the M15 chart, NQ is above the session VWAP at 30,827.62, the 200-period average at 30,747.23 and the 100-period at 30,715.38. That is a clean bullish stack.
But RSI near 68 has flashed a string of bearish divergence signals since the European open. In simple terms, price is inching to new highs while momentum is not keeping up. A dip back to VWAP would be a healthy reset. Losing it would put the 30,715–30,750 cluster back in play.
Outlook: Today’s U.S. Session
NQ has the cleaner chart, with rising averages and price near the highs, but it is stretched right under a big round-number barrier. YM is bouncing, yet it still trades below falling moving averages on the H1, so rallies into 52,000–52,100 are likely to meet sellers.
Either way, yields decide the day.
New orders for U.S.-manufactured durable goods were largely flat month-over-month at $338.6 billion in August 2026, following two consecutive monthly increases and compared to market forecasts for a 0.4% decrease.
The initial reaction has been muted but it will be interesting to see if U.S. equities catch a bid after the open.
Potential Scenario Matrix
| Scenario | Trigger | Nasdaq Impact | Dow Impact |
|---|---|---|---|
| Bull | Soft durable goods, calmer inflation expectations, 10-year yield eases back below 5.2% | Hourly close above 31,000, then the record area near 31,090 and 31,200 | Clears 51,910, then tests 52,000 and the 100-hour average at 52,104 |
| Base | Data roughly in line, 10-year steady near 5.2% | Choppy range between VWAP 30,828 and 31,000 | Range between VWAP 51,764 and 51,910 |
| Bear | Hot durable goods, higher inflation expectations, 10-year above 5.25% | Loses VWAP 30,828, opens 30,750 then 30,600 | Back below 51,764, opens 51,700 then 51,480–51,500 |
Trader Positioning Data - Nasdaq
Marketframework Positioning Edge Tool data is showing an extreme bearish divergence on NQ.
Profitable traders are 18% more short than unprofitable traders, holding 57% long exposure compared to 75% among unprofitable accounts.
As retail traders chased the rally up to 77% long, disciplined traders trimmed longs into strength, signaling growing resistance.