
The Setup: A Hawkish Hike, and a Bounce that’s Already Heavy
Gold went into Wednesday’s Federal Reserve meeting on the back foot and came out of it worse. The Fed raised its benchmark interest rate by 25 basis points (a quarter of a percentage point) to a range of 3.75%– 4.00%, its first hike since 2023 in a unanimous vote.
More important for gold was the message that came with it: the Fed’s “dot plot” (a chart showing where each official expects rates to go) penciled in at least one more hike this year. Of the 18 officials, 12 see one more increase and four see two more, and their growth and inflation forecasts were nudged higher.
The reaction was textbook. Gold spiked to roughly $4,368 into the decision, then sold off hard, tagging a six-week low near $4,235 before clawing back to about $4,313 by Thursday morning.
The U.S. dollar jumped to a two-month high and short-dated Treasury yields rose both of which raise the opportunity cost of holding gold, which pays no interest.
That is the backdrop for every chart below: a market that bought the dip but is fighting an uphill current.
The H4 Triangle: The Squeeze that Decides the Trend
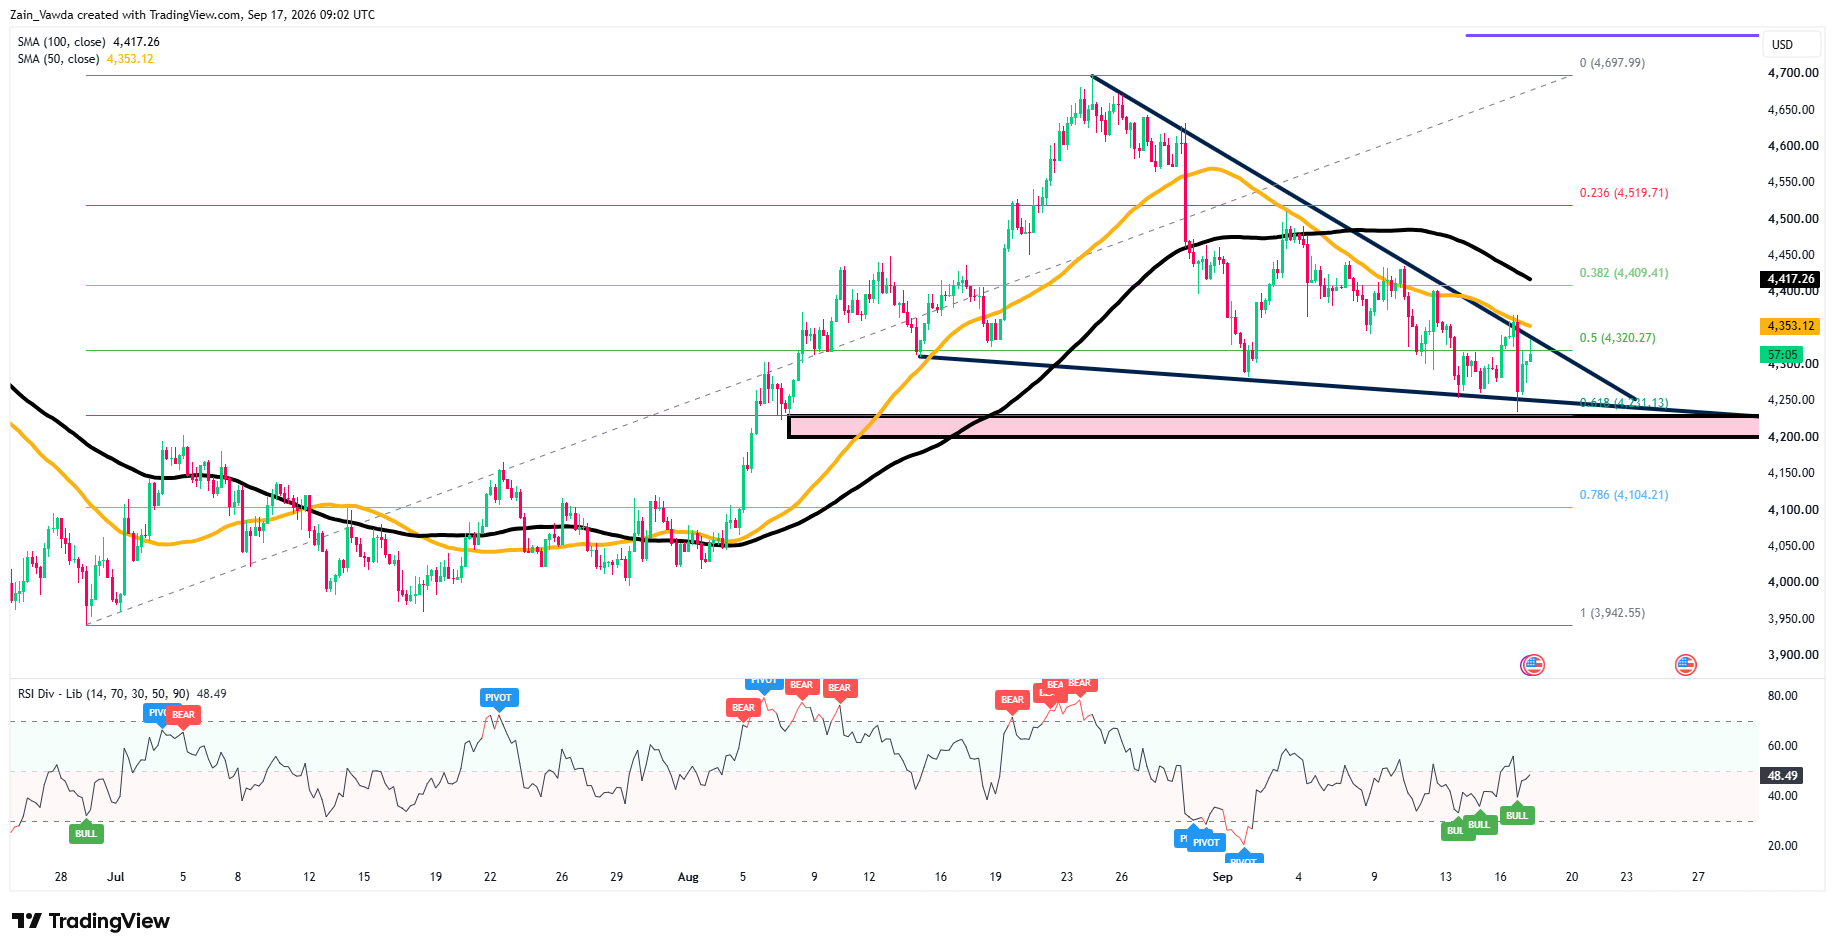
Step back to the 4-hour (H4) chart and the structure is a contracting triangle — price squeezing into an ever-tighter range between a falling ceiling and a rising floor. The ceiling is the down-sloping trendline off the late-August ~$4,700 high; the floor is the rising line built from the September lows, reinforced by the $4,200– $4,231 demand box (the 0.618 Fibonacci level, a common retracement marker). Price is coiling toward the apex around $4,250– $4,320.
The bias inside that triangle leans mildly bearish for now: gold sits below both the 50- and 100-period moving averages (about $4,353 and $4,417, and those averages are rolling over.
Momentum (RSI) is under the 50 mid-line but showed bullish divergence at the lows, which is exactly why the bounce happened.
Bottom line: the triangle is unresolved. A close outside either edge, not the noise inside it, sets the next real move.
Gold (XAU/USD) Four-Hour Chart, September 17, 2026
Source: TradingView
Zooming In: The H1 Bounce Runs Into the Wall
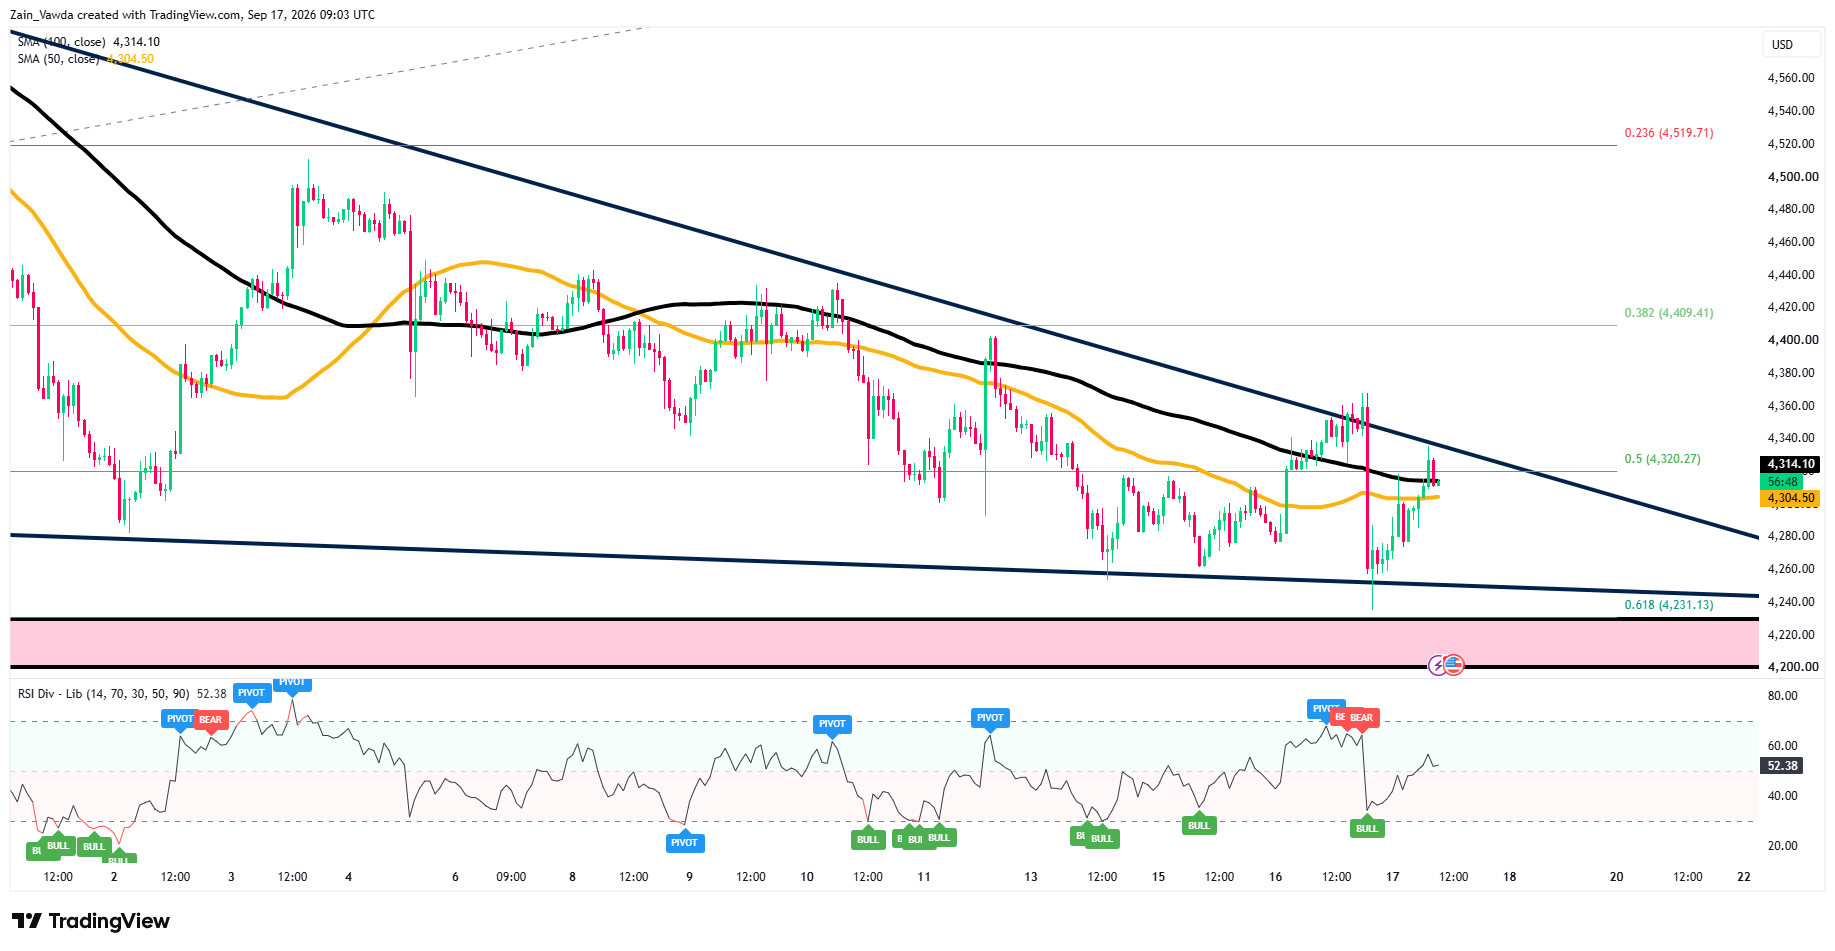
On the 1-hour (H1) chart you can see how the recovery is being built.
After the post-Fed washout to $4,235, gold climbed back inside its falling channel and is now pressing the $4,313– $4,320 zone, where the H1 100-period average ($4,314) and the 0.50 Fib ($4,320) sit almost on top of each other. That cluster is the near-term battleground.
Momentum has recovered back above its mid-line, so the bounce has some life, but it is knocking on resistance rather than breaking it.
A clean hourly close above $4,320 is the tell that buyers have taken the level; failure there keeps the $4,250– $4,285 floor in play.
Gold (XAU/USD) One-Hour Chart, September 17, 2026
Source: TradingView
The M15 Read: The Recovery is Running Short of Breath
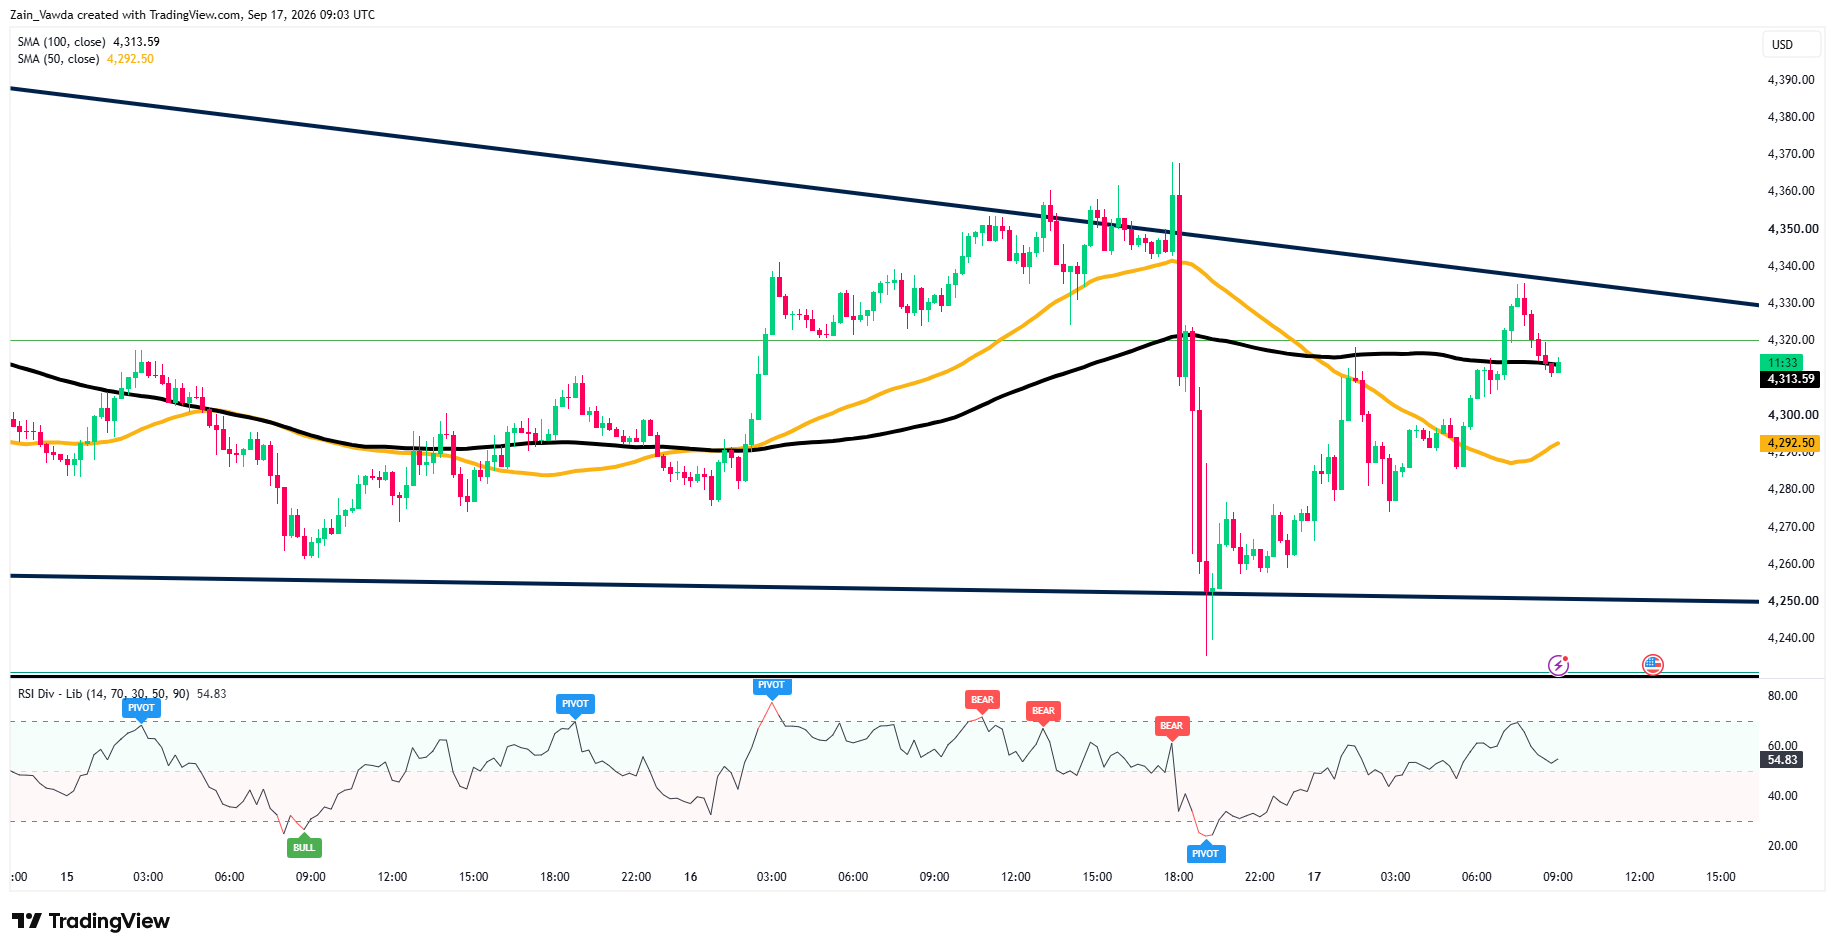
The 15-minute (M15) chart is where the caution flag sits. The rebound off $4,235 has stalled right at the same $4,313– $4,320 shelf, and it has done so with bearish RSI divergence, price pushing to new bounce highs while momentum makes lower ones, a classic sign that a move is tiring.
Gold is hugging its M15 100-average (~$4,314) with the 50-average (~$4,292) below. So the very short-term risk is a roll-over back toward $4,292, then $4,270 and $4,250, unless price forces its way through $4,320– $4,340 and turns that ceiling into a floor.
Gold (XAU/USD) M15 Chart, September 17, 2026
Source: TradingView
The Medium-Term Picture: What a Hawkish Fed Does to Gold
Zoom out from the charts and the FOMC decision matters most for what it does to gold’s two big drivers: real yields (interest rates after inflation) and the dollar.
A Fed that is hiking and signalling it may hike again in October or December pushes both higher, and both are headwinds for a metal that yields nothing.
ING summed the meeting up as “as hawkish as it gets,” with the dollar index up 0.6% to a two-month high and markets now free to price the next move as soon as October if data run hot.
There is a second, slower headwind. A big part of gold’s 2026 run was a “debasement” trade, buying bullion as a hedge against loose money and a weaker dollar. By pledging monetary discipline, the Fed raises the bar for that trade to come back.
For context, gold is still well off its early-2026 price above ~$5,300; the mid-$4,000s is a pullback zone, not a peak.
The offsets are real, though. Middle East tensions around the Strait of Hormuz keep a safe-haven bid under dips, and ING’s base case is for the dollar to stabilise now and soften into year-end but only if the Gulf de-escalates.
Right now the near-term news actually cuts the other way for the haven bid: oil fell on reports of extra Saudi cargoes via Oman, and President Trump is due to meet Gulf leaders at the UN next Tuesday, feeding diplomatic optimism.
Net: gold looks capped and corrective in the near term, structurally supported on deep dips, a range, with the risk skewed lower while the Fed stays on the front foot and the dollar stays firm.
Three Ways this Breaks (Into Friday’s Bank of Japan Decision)
The nearest catalysts are the triangle break itself, US jobless-claims data, and the Bank of Japan on Friday, a hawkish BoJ would lift the yen and could take some steam out of the dollar.
Potential Scenarios Moving Forward
| Scenario | What It Looks Like & What Drives It |
|---|---|
| Bull | A clean H1 hourly close back above 4,320 opens 4,340, then a run at the 4,353– 4,409 wall. Needs the dollar rally to pause, a hawkish Bank of Japan lift for the yen on Friday, or fresh Gulf escalation to revive the safe-haven bid. |
| Base | Gold keeps chopping inside the triangle, roughly 4,250– 4,353. The bounce keeps stalling at 4,313– 4,320 (where M15 momentum is already fading), and price drifts sideways as the market waits to price the Fed’s next move. |
| Bear | A loss of 4,285 exposes 4,250, and a triangle break-down targets the 4,200– 4,231 demand box, then 4,104 (0.786 Fib) if that cracks. Trigger: the dollar extends its two-month high or hot data / firmer oil pulls an October hike into view. |
Gold Trader Positioning
The Micro Gold ($MGC) positioning data from MarketFrameworks Positioning Edge Tool is flashing an EXTREME BULLISH DIVERGENCE, driven by a clear structural split between smart money accumulation and retail shorting. Profitable traders are currently 12% more long-biased than their unprofitable counterparts, holding 55% net-long exposure.
In contrast, unprofitable accounts have leaned heavily into short territory, with only 42% remaining long (leaving 58% net-short).
This positioning divergence creates a strong bullish backdrop as experienced traders quietly absorb liquidity and build long exposure while the retail crowd attempts to fade the price action.
Coupled with a 4% uptick in volume, this setup indicates that retail shorts are increasingly vulnerable to a squeeze should Gold extend its upward momentum.