People lump gold and silver together as “precious metals.” Right now, that habit is misleading.
Gold’s demand comes mostly from investors and central banks buying a store of value, and very little of it gets used up.
Silver is different: more than half of yearly silver demand comes from industry, solar panels, electronics, wiring, and circuit boards. Silver is the best conductor of electricity there is, so when factories build more electronic things, they use more silver.
That is why silver trades partly like a growth asset, and gold does not.
The AI Angle
A growing part of silver’s industrial demand is now tied to the artificial-intelligence (AI) buildout.
Data centres, the buildings full of computers that run AI use silver in their servers, connectors, and power systems. That demand is still small, roughly 20 to 40 million ounces a year, but it is growing fast, by an estimated 15% to 25% a year, and it sits right next to solar power, silver’s single biggest industrial user.
Here is the risk. Over the weekend, the heads of Anthropic and OpenAI both argued that AI development should slow down. If the firms building AI spend less on new data centres, what traders call “capex,” or capital spending one of silver’s fastest-growing demand pockets cools with it.
Gold has no such exposure. Nobody buys gold because a data centre needs it.
Why the “Silver Shortage” Won’t Rescue the Price Yet
Bulls will note that silver is heading for a sixth straight year of supply falling short of demand, a gap of roughly 46 million ounces in 2026.
That matters over time. About three-quarters of silver is mined as a by-product of metals like copper and zinc, so miners cannot quickly dig up more just because the price rises.
But a shortage on paper does not set the price day to day. Today the market is driven by something else: a 10-year Treasury yield near 5% and a Federal Reserve that may raise rates on Wednesday. High interest rates hurt metals that pay no income, and they hit the industrial ones hardest because those sell off alongside growth fears.
That is why silver is down around 2,2% on Monday while gold, only around 1,7%, lifting the gold-to-silver ratio near 68, it now takes about 68 ounces of silver to buy one ounce of gold.
Gold/Silver Ratio

Source: Goldprice.org
Silver Technical Outlook
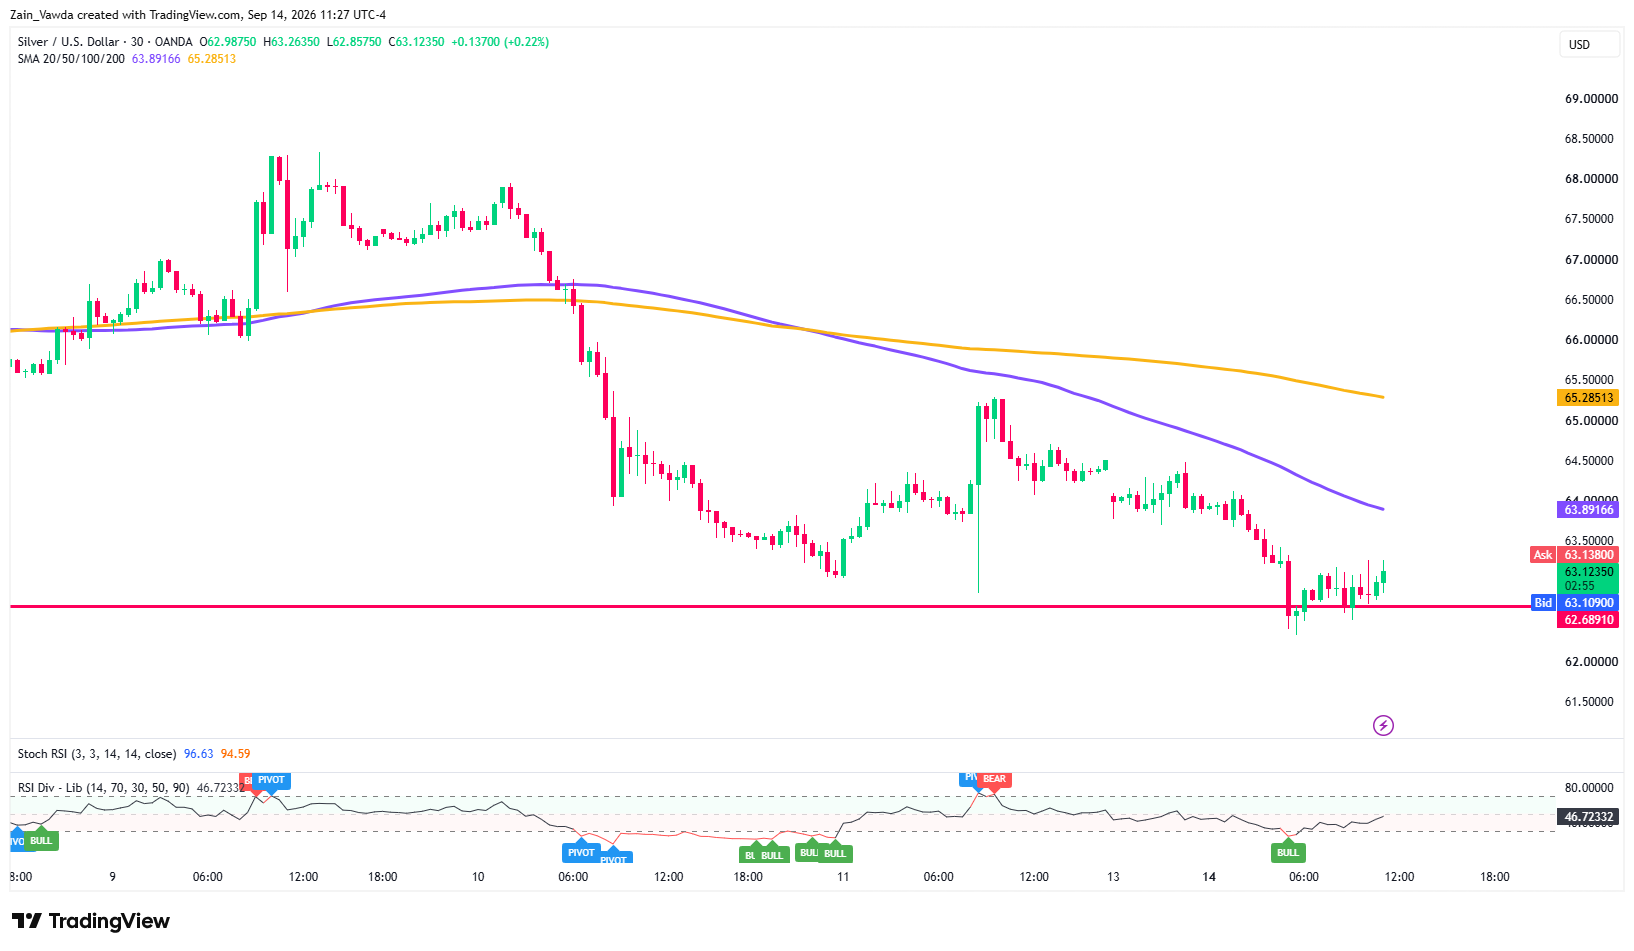
Looking at silver in the short term on the 30-minute chart and it maintains a short-term bearish bias, trading below both the 100MA ($63.89) and the 200MA ($65.28).
Price recently tested critical horizontal support near $62.69–$63.11, where a bullish RSI divergence signal sparked a minor stabilization.
Currently consolidating around $63.12, the Stochastic RSI is nearing overbought territory (>94), suggesting momentum for this brief rebound may be limited.
If buyers manage a continuation, initial dynamic resistance rests at $63.89, followed by stronger overhead resistance near $65.28. Conversely, a decisive breakdown below the $62.69 floor would reconfirm the prevailing downtrend, opening the door for further downside movement.
Overall, the technical outlook favors sellers unless price convincingly reclaims the $63.89 level.
XAG/USD 30M Chart, September 14, 2026
Source: TradingView
What it Means for Traders Over the Medium-Term
In the medium-term you could use the gold-silver ratio as a simple risk gauge.
When investors worry about growth as they did after the AI warning, silver usually underperforms gold and the ratio rises. A hawkish Fed plus louder AI-spending doubts could widen that gap further. But if yields fall and the AI buildout looks safe again, silver has more room to bounce back hard, precisely because it fell further.
Gold fights one battle: the Fed. Silver fights two: the Fed and the AI trade.


