
July nearly broke the artificial intelligence (AI) trade. August put it back together but it did so in a month that is historically kind to tech, right before rolling into the month that historically isn’t.
The July-August Round Trip
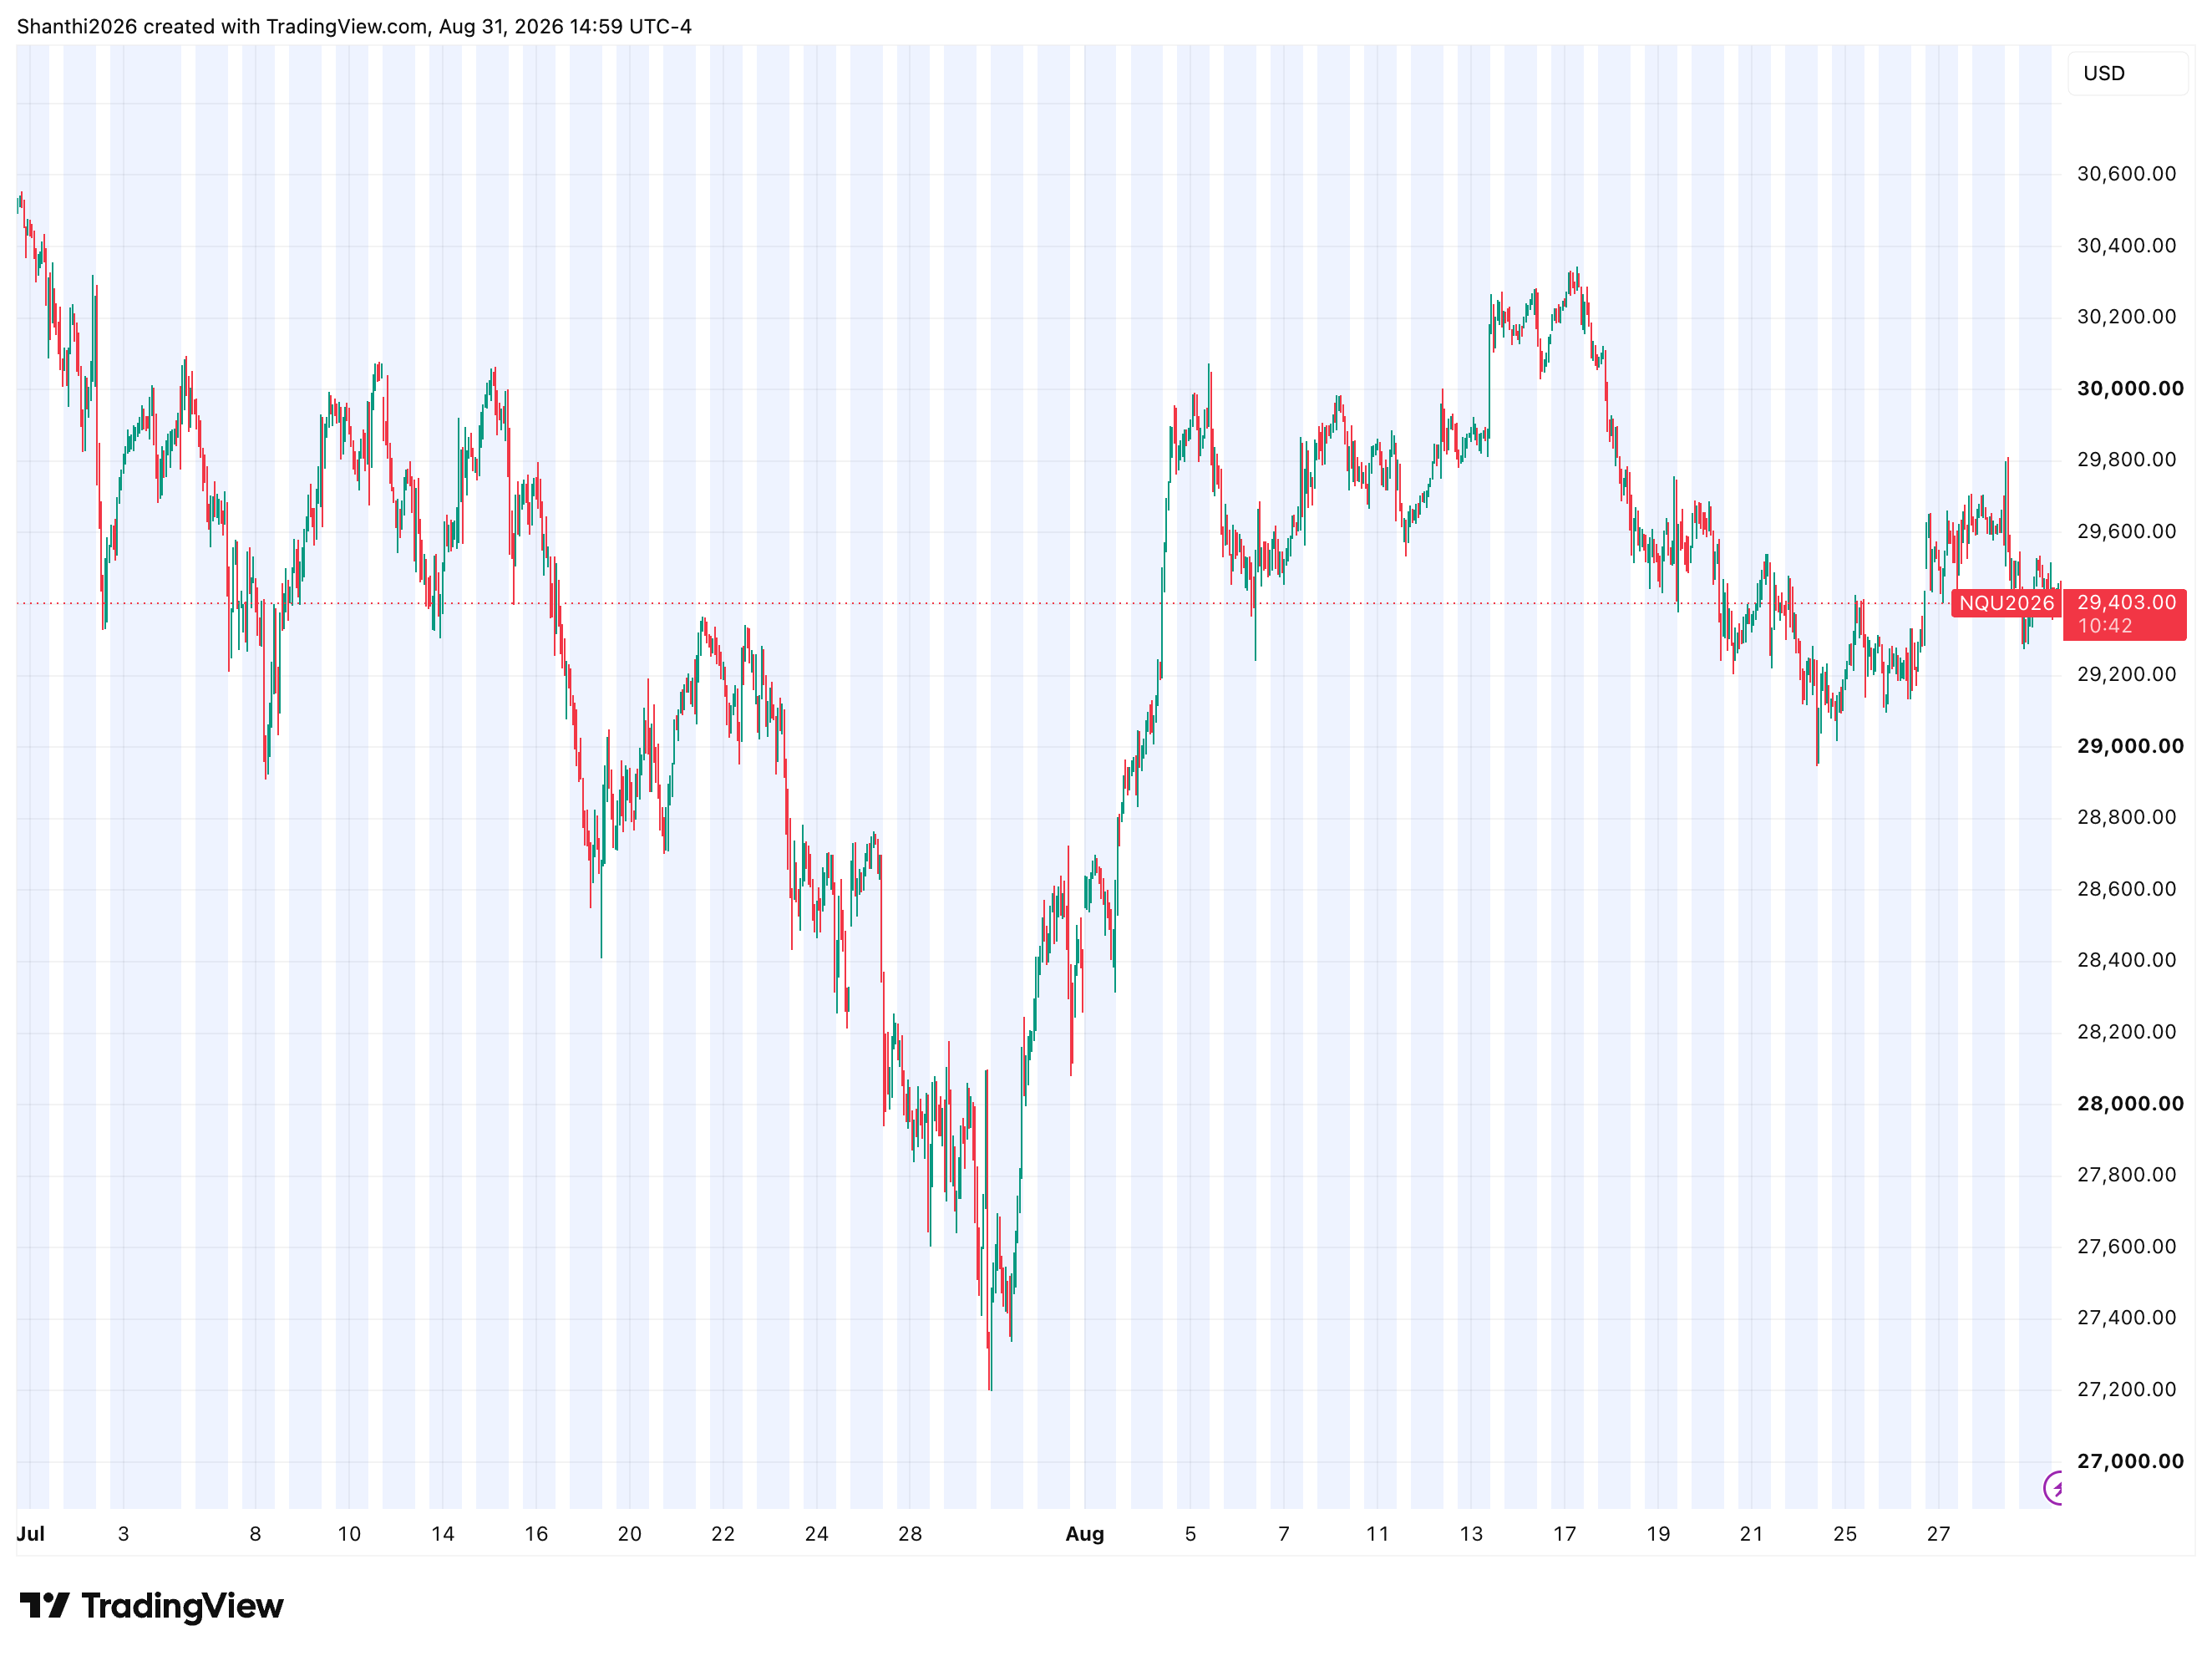
The Nasdaq 100 (NDX), the underlying index for the Nasdaq E-mini futures (NQ) fell about 7% in July, its steepest monthly drop since March 2025, as an escalation in the U.S.-Iran conflict and the resultant volatility in oil prices, a hawkish Federal Reserve and a semiconductor-led sell-off together hit all at once. This was enough to push the index into technical correction territory, down over 11% from its recent highs.
August reversed that story almost as fast as July wrote it. A dramatic reversal saw the index add roughly 9.3% in just four trading sessions in early August, its sharpest rally since the tariff-driven recovery of April 2025. The catalysts being strong earnings that reignited the AI trade.
NQ Chart- The Rally & Rebound
Source: TradingView
Despite August’s advance,the NDX isn’t back to where it started the summer. The index hit an all-time high (intraday) just above 30,760 on June 3rd. As of late August, it sat roughly 4% below that mark, meaning the recovery story is really a partial one, closer to a strong rebound, rather than a full round trip.
What Actually Drove August
A handful of specific events did most of the work.
Nvidia’s earnings: The AI stalwart’s earnings released on August 26 showed a double beat and, more importantly, the company delivered a fiscal year 2028 revenue growth forecast of about 70%, well above the 45% Wall Street had modeled. Nvidia’s stock’s nearly 9% single-day surge post earnings added roughly $442 billion to the company’s market capitalization, and lifted the broader sharply higher in that session alone.
A Fed regime change under pressure: Fed Chair Kevin Warsh used his Jackson Hole speech last Friday to deliver an unexpectedly hawkish message, pushing up the September rate-hike odds from roughly 40% to as high as 60% within days, and pulling chip stocks lower into month-end.
Geopolitical noise as persistent backdrop: An on-again, and off-again Iran standoff kept oil prices choppy all month, occasionally spilling into equity sentiment without derailing the broader tech rally.
How August Stacks Up Historically
By numbers, August was fairly normal, even though the path there was anything but normal. Over the past years, the Nasdaq 100 had finished higher almost 65% of the time, with the average gains north of 1%, making August a stronger month, alongside January, March, April, May and July. This year’s outsized gain is well above the historical average,
NDX’s historical performance shows that after a roughly monthly decline of more than 5%, such as the one seen this July, it has historically gained about 2.6% over the following month and roughly 8.2% over the three months. August’s snap back was considerably stronger than the historical average rebound, which cuts both ways. Either the AI trade has more genuine momentum than a typical post-sell-off bounce, or the rally has already run ahead of what the base rate would suggest, leaving less room for error in September.
The September Problem
Here’s the seasonal catch. September is the single worst month of the year for the NDX, going back decades. Over the past decade, the index has averaged a loss of roughly 1.7% in September, advancing in only three of the last 10 years. Over a 20-year window, the picture is somewhat better but still negative on average, and going back to 1945, August and September are the only back-to-back months where the S&P 500 has posted a negative average return. Some attribute the pattern to portfolio rebalancing and year-end tax-loss positioning, although there is no settled explanation,
That means, the NDX heads into September carrying three separate tensions at once, namely:
- A rate-hike probability that jumped sharply in the final week of August
- A valuation now sitting only modestly below all-time highs after one of the sharpest rebounds in over a year
- A calendar effect that has been the market’s most reliable headwind of any month, for decades
What to Watch Next
September will test whether August’s rebound was the start of a durable recovery or simply a powerful countertrend move. For NQ traders, the first question is whether the NDX can reclaim and hold its June record high near 30,760. A sustained break above that level would signal that the July correction has been absorbed and put the bulls back in control. Failure to clear the record, particularly if accompanied by rising Treasury yields and renewed hawkish Fed expectations, would leave the index vulnerable to another bout of profit-taking.
The Fed-rate path will be the key macro variable. Warsh’s hawkish Jackson Hole message has already tightened financial conditions at the margin, and markets will now scrutinize incoming inflation and labor-market data for clues on whether September easing is still justified. A further rise in rate-hike expectations would be particularly challenging for the NDX because of its long-duration characteristics. Conversely, any evidence that inflation is cooling without a sharp deterioration in growth could allow yields to stabilize and give technology stocks room to extend August’s rebound.
AI leadership will be the other critical test. Nvidia’s earnings showed that the fundamental AI story remains powerful, but the market will need to see that strength broaden beyond one earnings event. Semiconductor stocks, megacap technology and other AI beneficiaries will need to maintain leadership for the NDX to push decisively into new highs. If that leadership begins to narrow, August’s rally could start looking increasingly fragile.
For NQ traders, the setup therefore comes down to price versus macro momentum. Holding above August support while yields stabilize would favor another attempt at the highs. A failure to hold those levels, particularly alongside higher yields and weaker semiconductor performance, would increase the odds that September’s seasonal weakness becomes more than just a historical statistic.
The positioning data adds a bearish wrinkle to the September setup. NQ is showing a mild bearish divergence, with profitable traders holding a smaller long position than unprofitable traders: 41.6% of profitable traders are long versus 48.5% of unprofitable traders at the latest reading. Overall, only 40% of traders are long. If September brings a pullback, positioning could amplify the move as crowded or poorly timed longs are unwound. Conversely, a sustained move back above key resistance could force short-covering and provide additional fuel for the NDX rebound.


