U.S. equity futures surged following Federal Reserve Chair Kevin Warsh’s inaugural keynote address at the Jackson Hole Economic Symposium, as market participants digested a speech balancing hawkish inflation warnings with optimism surrounding AI-driven economic productivity.
Initial intraday volatility quickly gave way to aggressive buying across both S&P 500 (ES1!) and Dow Jones Industrial Average (YM1!) contracts.
Fundamental Roundup: Warsh at Jackson Hole
Warsh used his first Jackson Hole address as Fed Chair to outline a structural shift toward reduced forward guidance and renewed discipline regarding price stability.
Key Takeaways & Quotes:
- A "Quieter Fed" Communication Strategy: Warsh expressed skepticism over detailed forward guidance, arguing that over-communicating limits policy flexibility. He noted that a "quieter Fed" will better steer the economy toward price stability and urged that investors should not be "looking primarily to the Fed for their next trade".
- Firm Inflation Mandate: Reaffirming the Fed's 2% target, Warsh stressed that price stability remains paramount and accepted accountability for recent multi-year price pressures, stating that responsibility for 65 months of sustained elevated inflation "sits squarely with the central bank".
- Policy Flexibility: Warsh remarked that current financial conditions are difficult to describe as restrictive, leaving the door open for additional tightening if inflation fails to cool, though he declined to commit to a specific interest rate path.
- Growth & Productivity Optimism: Counterbalancing his inflation warnings, Warsh struck an upbeat tone on economic expansion, highlighting substantial capital investments in AI infrastructure and technological innovation as long-term growth drivers.
S&P 500 Futures (ES1!) Technical Outlook
4-Hour (H4) Chart:
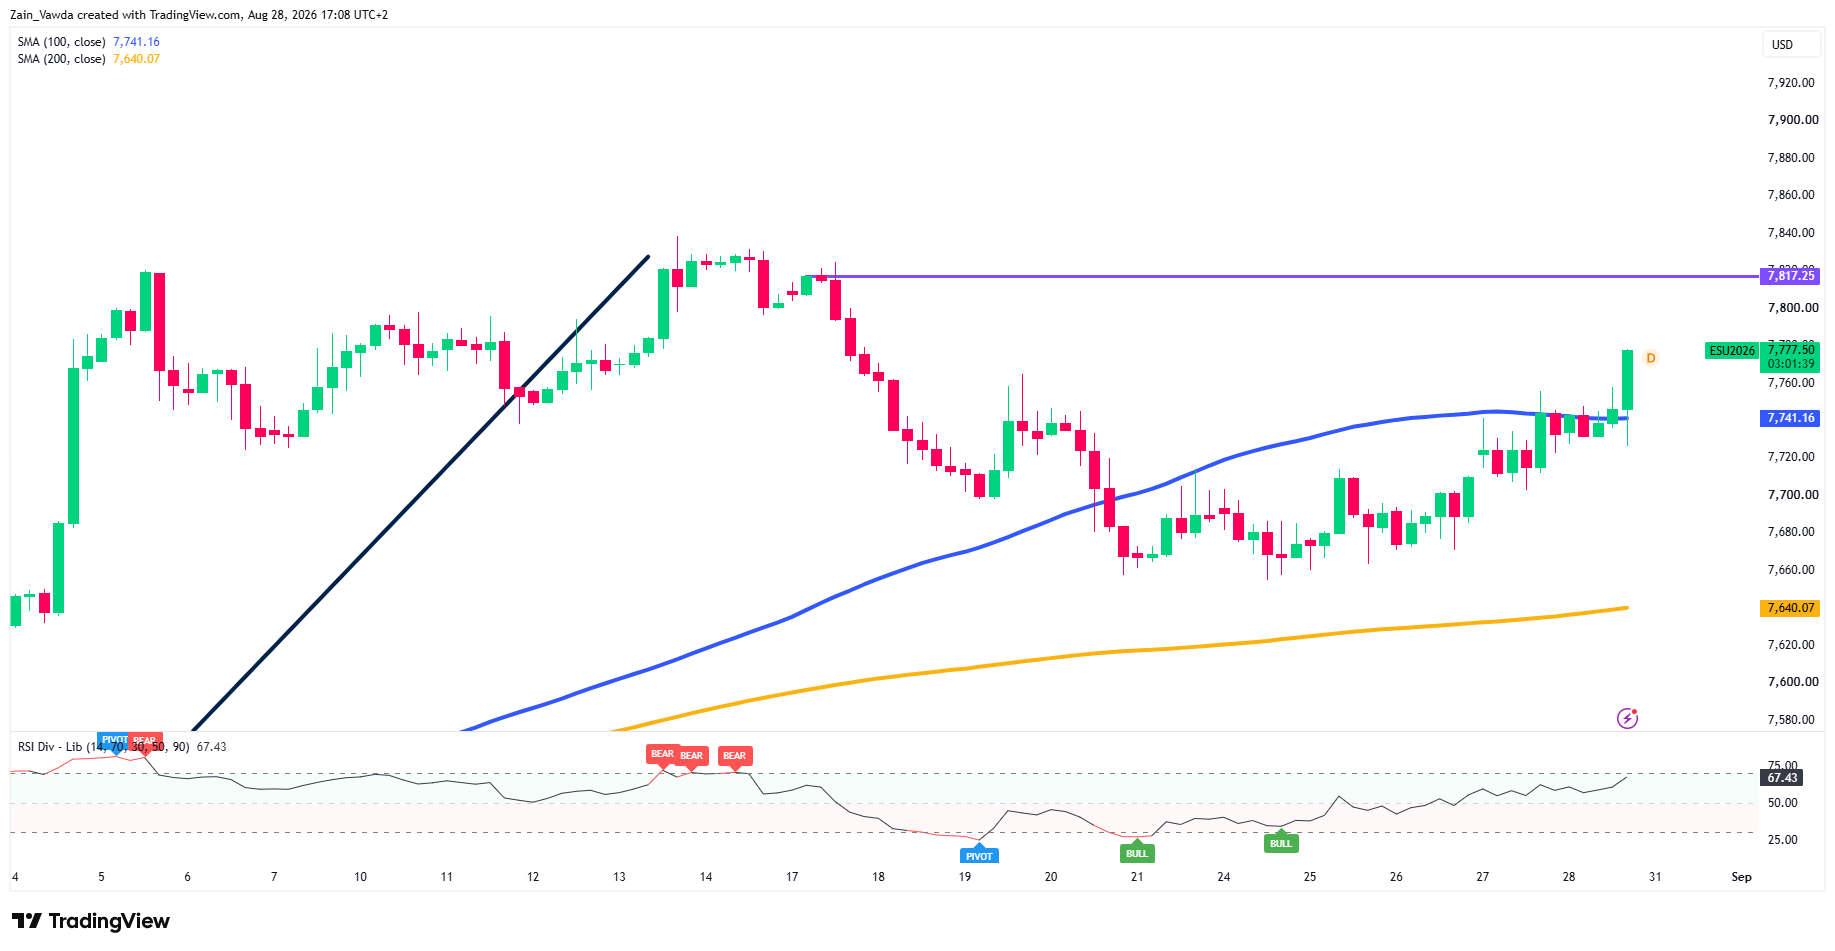
- Trend & Structure: The H4 timeframe shows a strong bullish recovery off the structural support zone around 7,640.07, where the 200 Simple Moving Average (SMA) held firm. Price action has decisively broken back above the 100 SMA (7,741.16), lifting contracts toward 7,778.00.
- Key Levels: Immediate overhead target and resistance rests at the major swing high of 7,817.25. Downside support shifts to the 100 SMA at 7,741.16, followed by structural base support at 7,640.07.
- Indicators: The 14-period RSI sits at 67.43, reflecting strong bullish momentum while maintaining headroom before reaching extreme overbought territory on the higher timeframe.
S&P 500 Four-Hour Chart, August 28, 2026
Source: TradingView
1-Hour (H1) Chart:
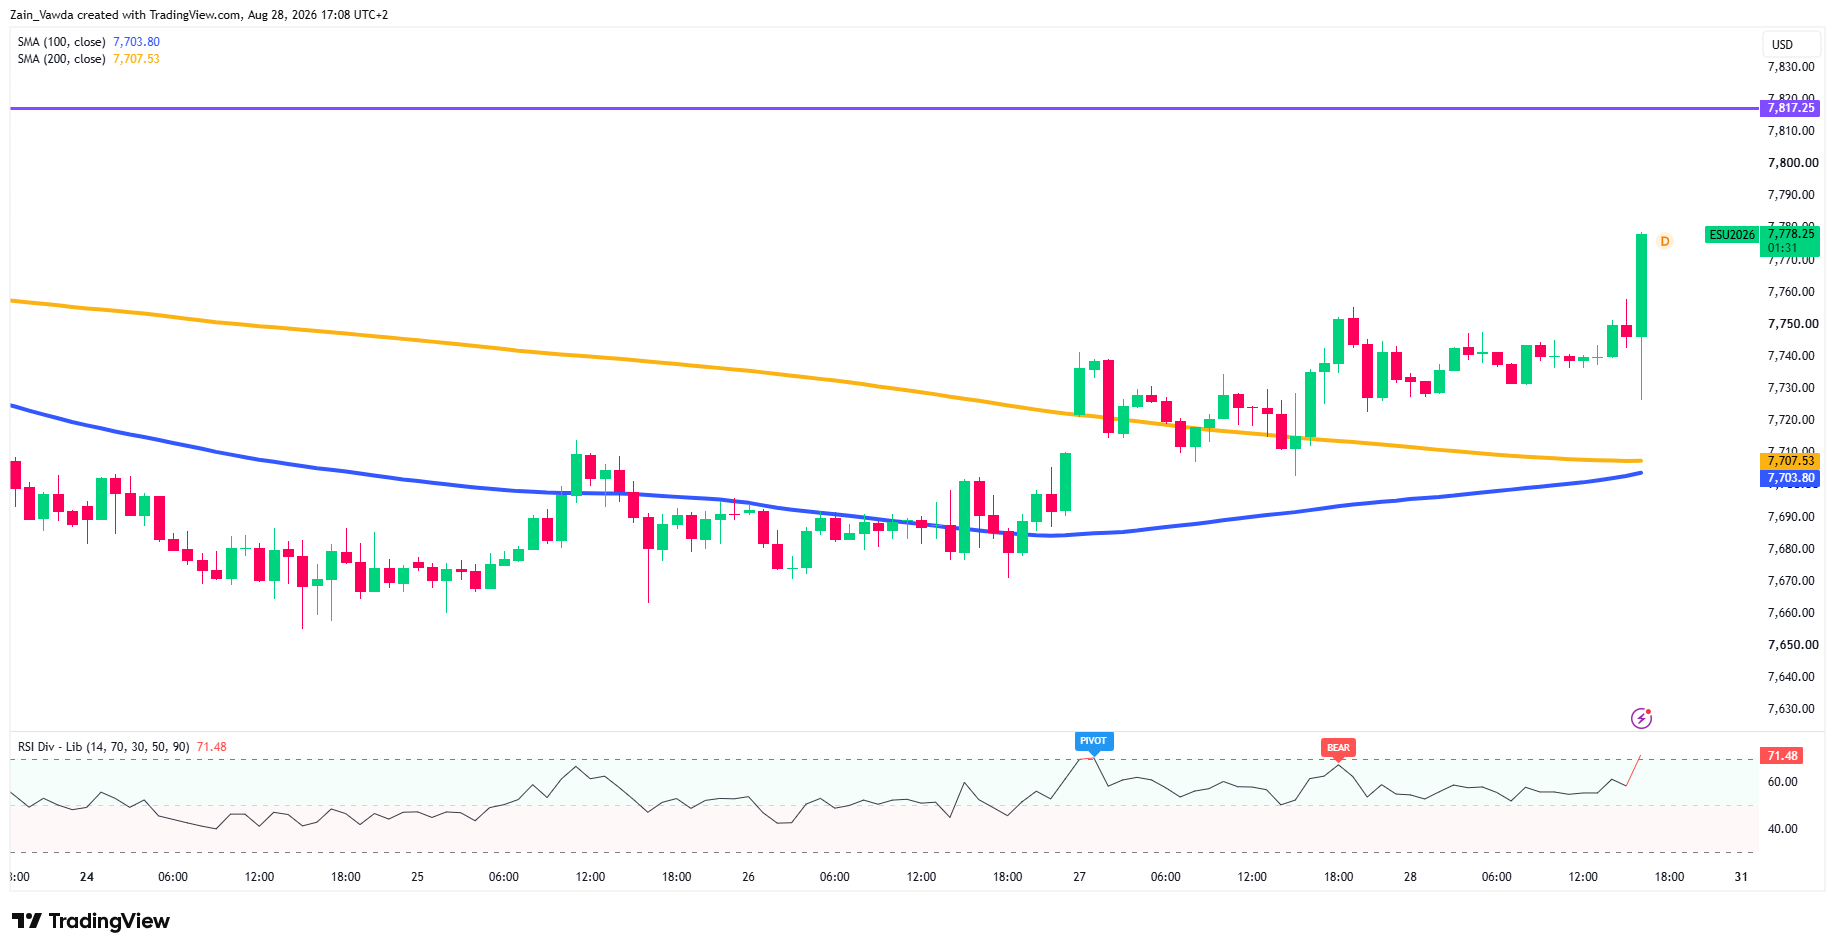
- Trend & Structure: Price completed a clean bullish expansion out of a tight consolidation range between 7,730 and 7,750. Moving averages have converged positively below price, with the 100 SMA (7,703.80) and 200 SMA (7,707.53) creating a dense support floor.
- Key Levels: Overhead room extends toward 7,817.25. First-line dynamic support is located at 7,740.00, with deeper support at the 7,703–7,707 SMA cluster.
- Indicators: The H1 RSI has pushed into overbought territory at 71.48, signaling strong buying pressure but flagging the potential for brief intraday consolidation before the next leg higher.
S&P 500 One-Hour Chart, August 28, 2026
Source: TradingView
15-Minute (M15) Chart:
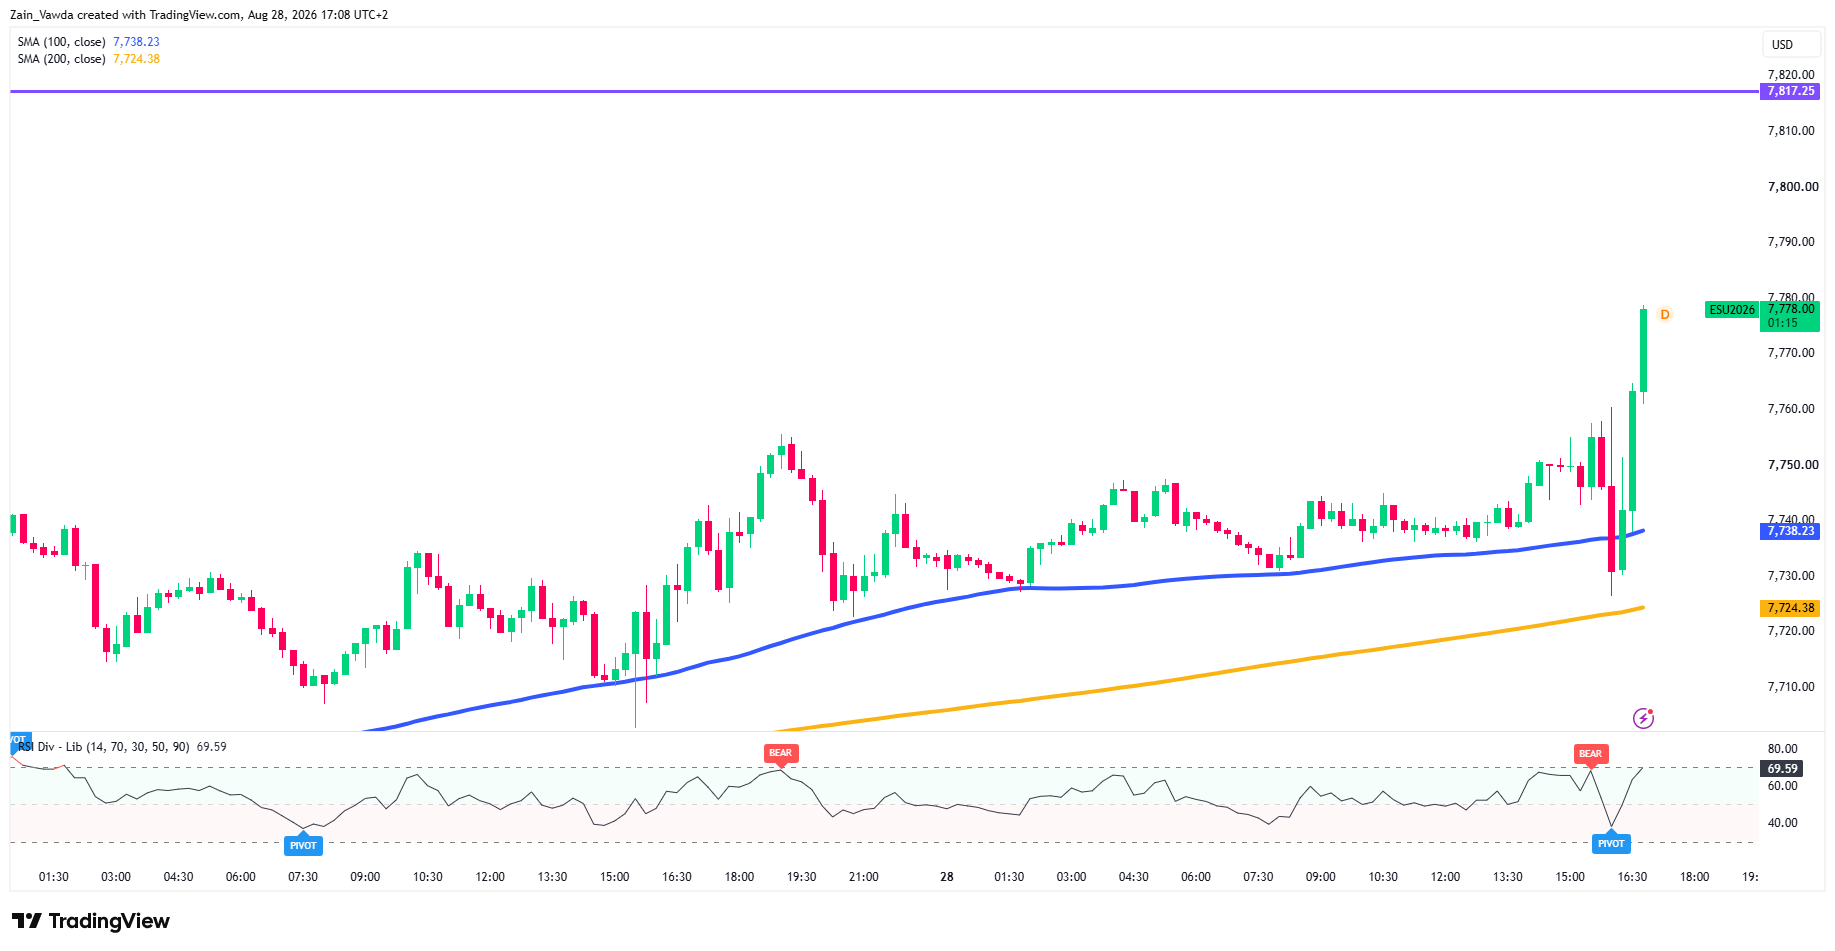
- Trend & Structure: The immediate event-driven price action saw a quick probe down to test the 200 SMA (7,724.38) and 100 SMA (7,738.23) before an explosive single-bar surge propelled prices to 7,778.00.
- Key Levels: Immediate intraday support sits at 7,738–7,740, followed by 7,724.
S&P 500 M15 Chart, August 28, 2026
Source: TradingView
Dow Jones Futures (YM1!) Technical Outlook
4-Hour (H4) Chart:
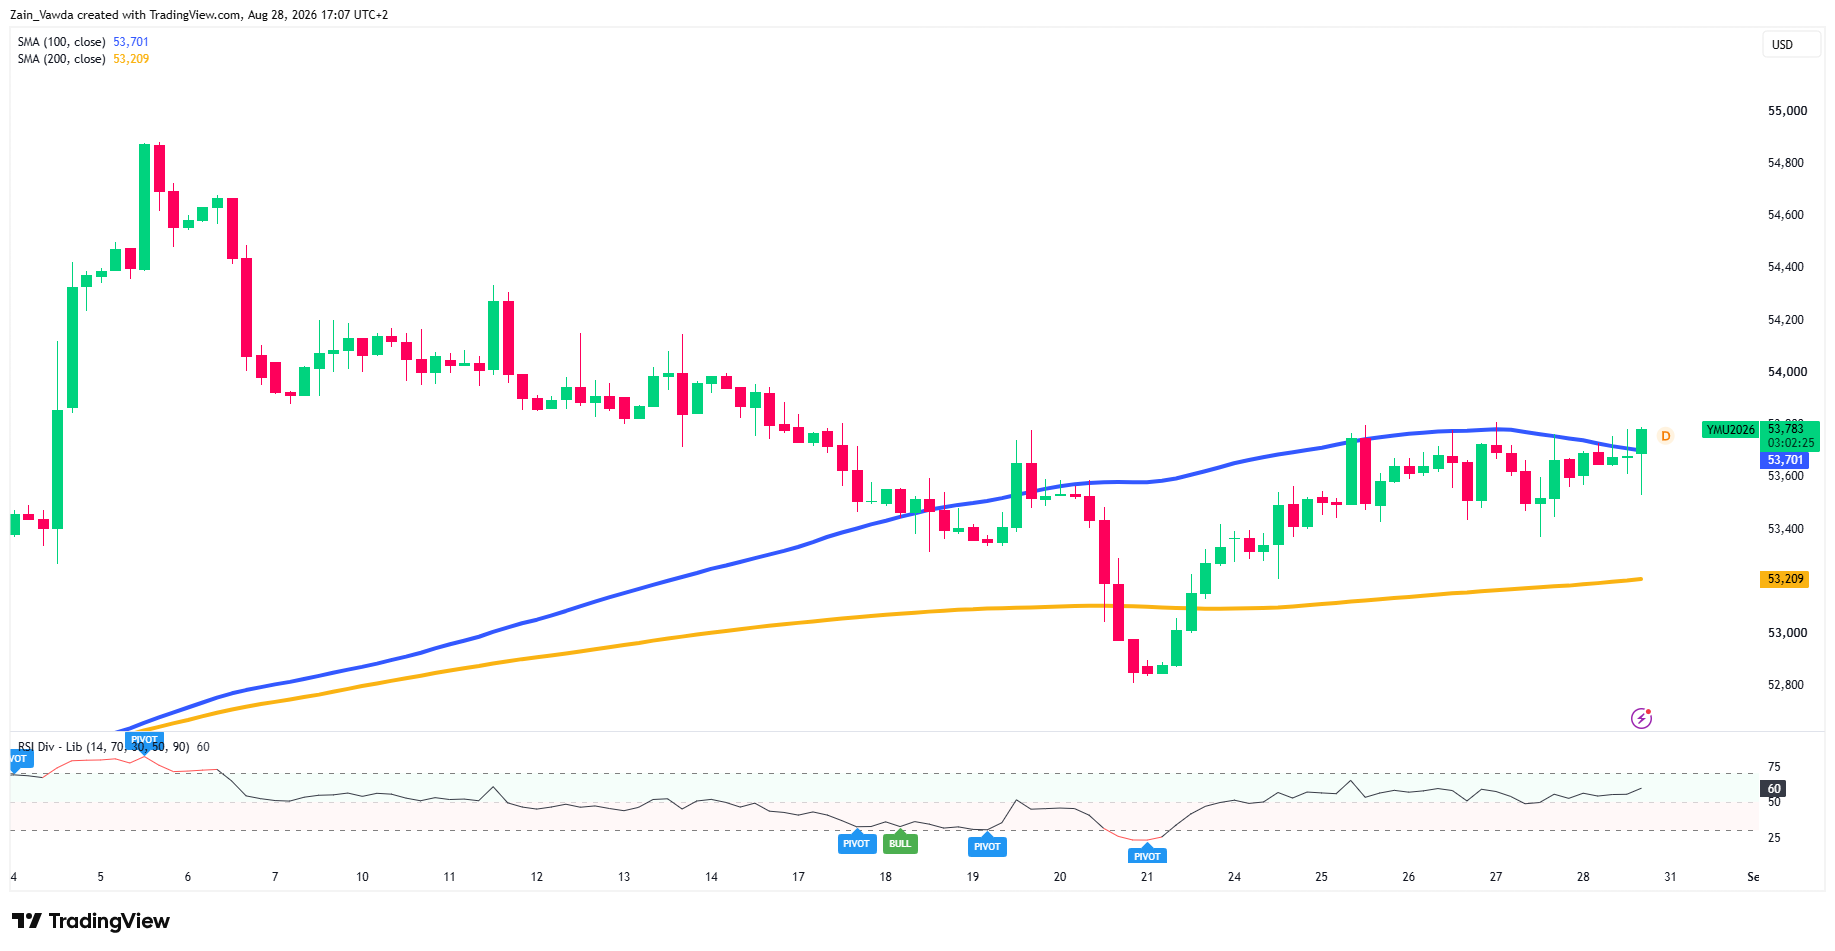
- Trend & Structure: Having formed a double-bottom base near 52,800 on August 21, the Dow has steadily printed higher lows. The index is now challenging the 100 SMA at 53,701, trading near 53,783.
- Key Levels: Immediate resistance is tested around 53,800, with potential upside expansion toward the prior high region above 54,400. Structural support remains anchored by the 200 SMA at 53,209.
- Indicators: The H4 RSI stands at 60.00, moving out of neutral territory and favoring further upside.
Dow Jones Four-Hour Chart, August 28, 2026
Source: TradingView
1-Hour (H1) Chart:
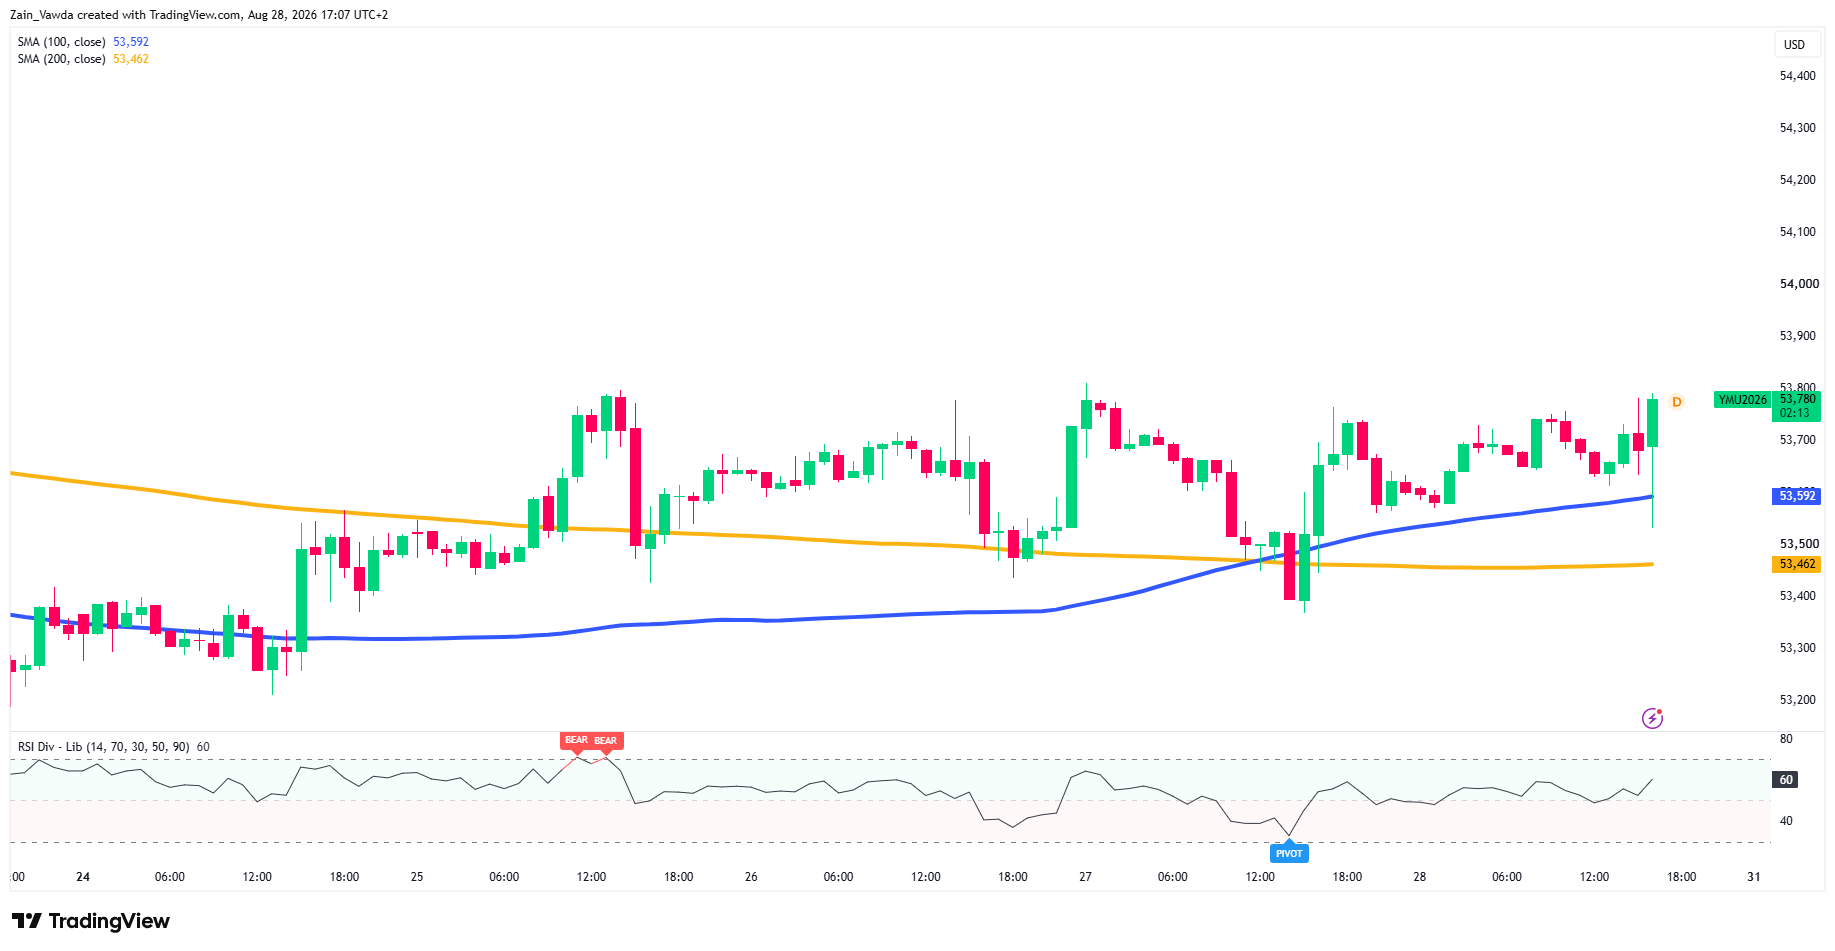
- Trend & Structure: The H1 structure displays a clear reclaim of both the 200 SMA (53,462) and 100 SMA (53,592), turning these key averages back into technical support. Price is pressing directly against horizontal resistance near 53,800.
- Key Levels: A confirmed break above 53,800 opens the path toward 54,000 and 54,200. Downside support is marked at 53,592 (100 SMA) and 53,462 (200 SMA).
- Indicators: H1 RSI sits at 60.00, leaving ample room for trend continuation should resistance break.
Dow Jones One-Hour Chart, August 28, 2026
Source: TradingView
15-Minute (M15) Chart:
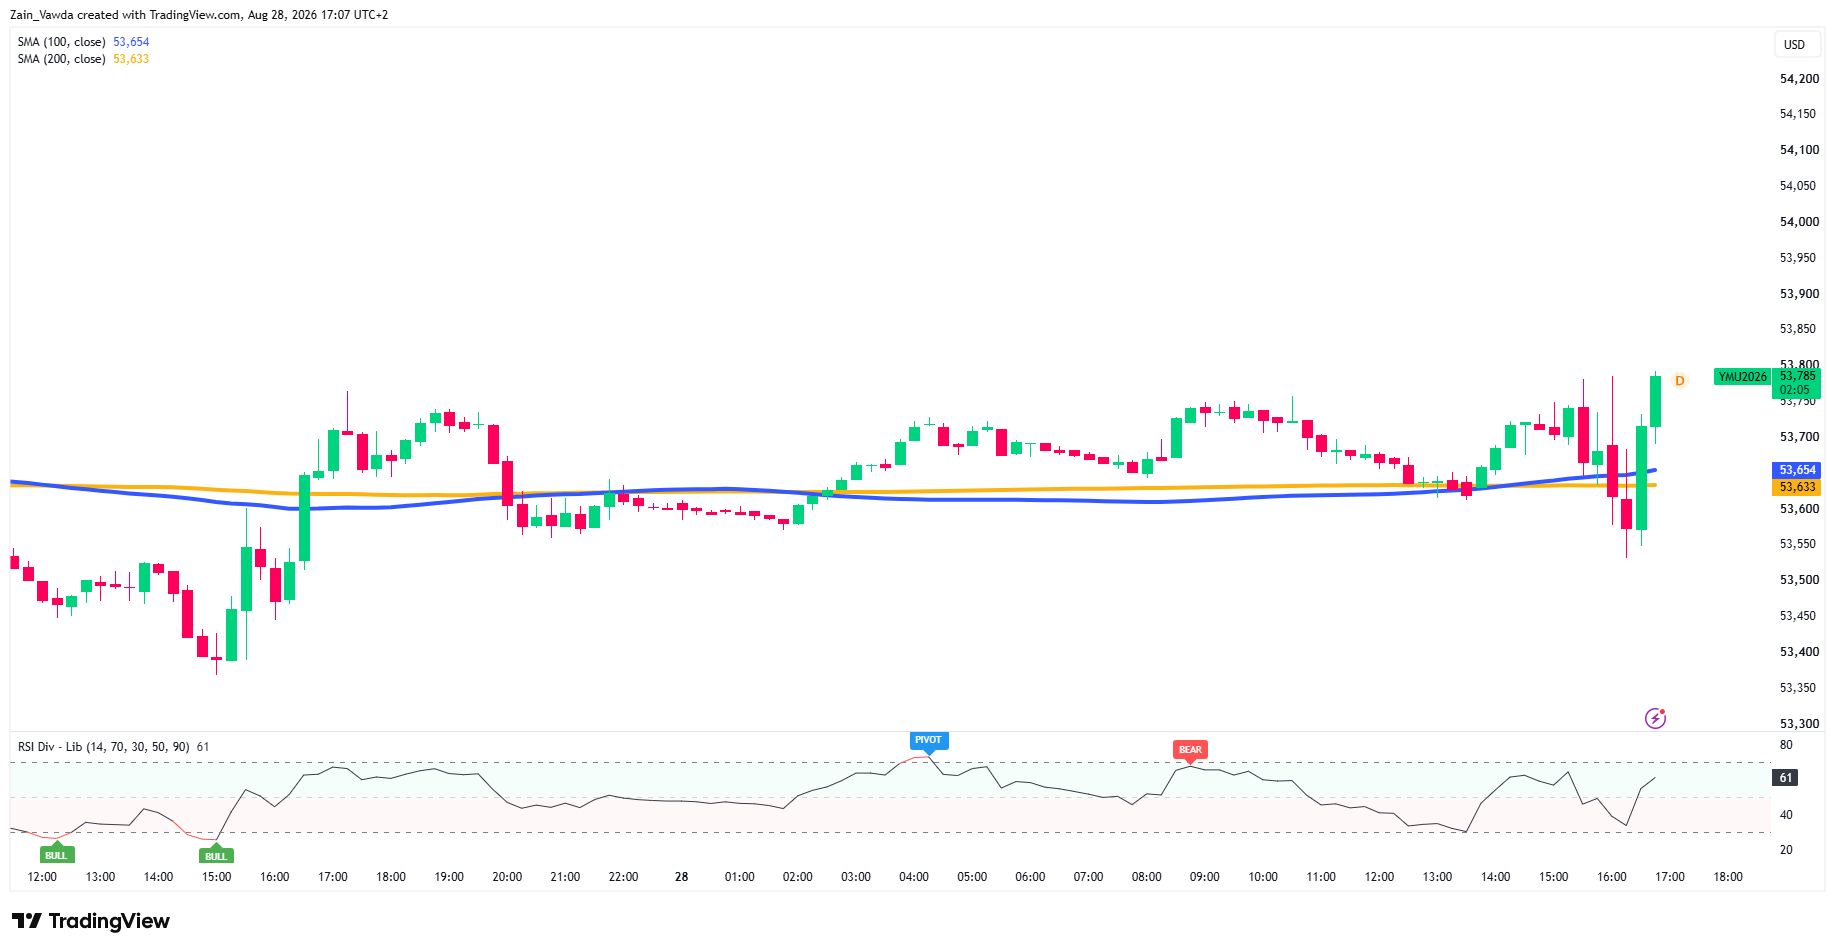
- Trend & Structure: High short-term volatility saw an initial dip down to 53,530 before buyers stepped in aggressively, driving price back above both the M15 100 SMA (53,654) and 200 SMA (53,633) to print highs of 53,785.
- Key Levels: Immediate intraday pivot support is established at 53,633–53,654.
Dow Jones M15 Chart, August 28, 2026
Source: TradingView
Entering the close of the week, equity bulls maintain strong technical control across both indices following the initial market digest of Chair Warsh's speech.
A sustained close for the S&P 500 above 7,740 keeps the path clear for a retest of the major 7,817.25 high, while the Dow Jones requires a decisive hold above 53,800 to confirm a larger trend continuation toward the 54,000+ zone.
To keep an eye on how traders are positioned heading into the weekend, take a look at the MarketFramework Positioning Edge Tool.


