Gold futures initially caught a minor bid on Tuesday morning, opening slightly higher at around $4570.60/oz, before face-planting down toward the $4467/oz region in early US trade as macro forces aggressively reasserted themselves.
The lack of clarity on the US-Iran situation has temporarily pushed macro factors to the fore once more, with rising yield and rate hike bets fueling a US Dollar rally and thus weighing on the precious metal.
The Macro Drivers: Yields, the Greenback, and a Trump Twist
The Yield Surge (US 10-Year and 30-Year)
The absolute biggest headwind for non-yielding bullion right now is what is happening in the global bond markets. We are seeing a fierce selling spree in bonds, which has pushed global yields to multi-period highs.
The US 10-year Treasury yield has continued its march upward, hovering near its highest marks since early 2025.
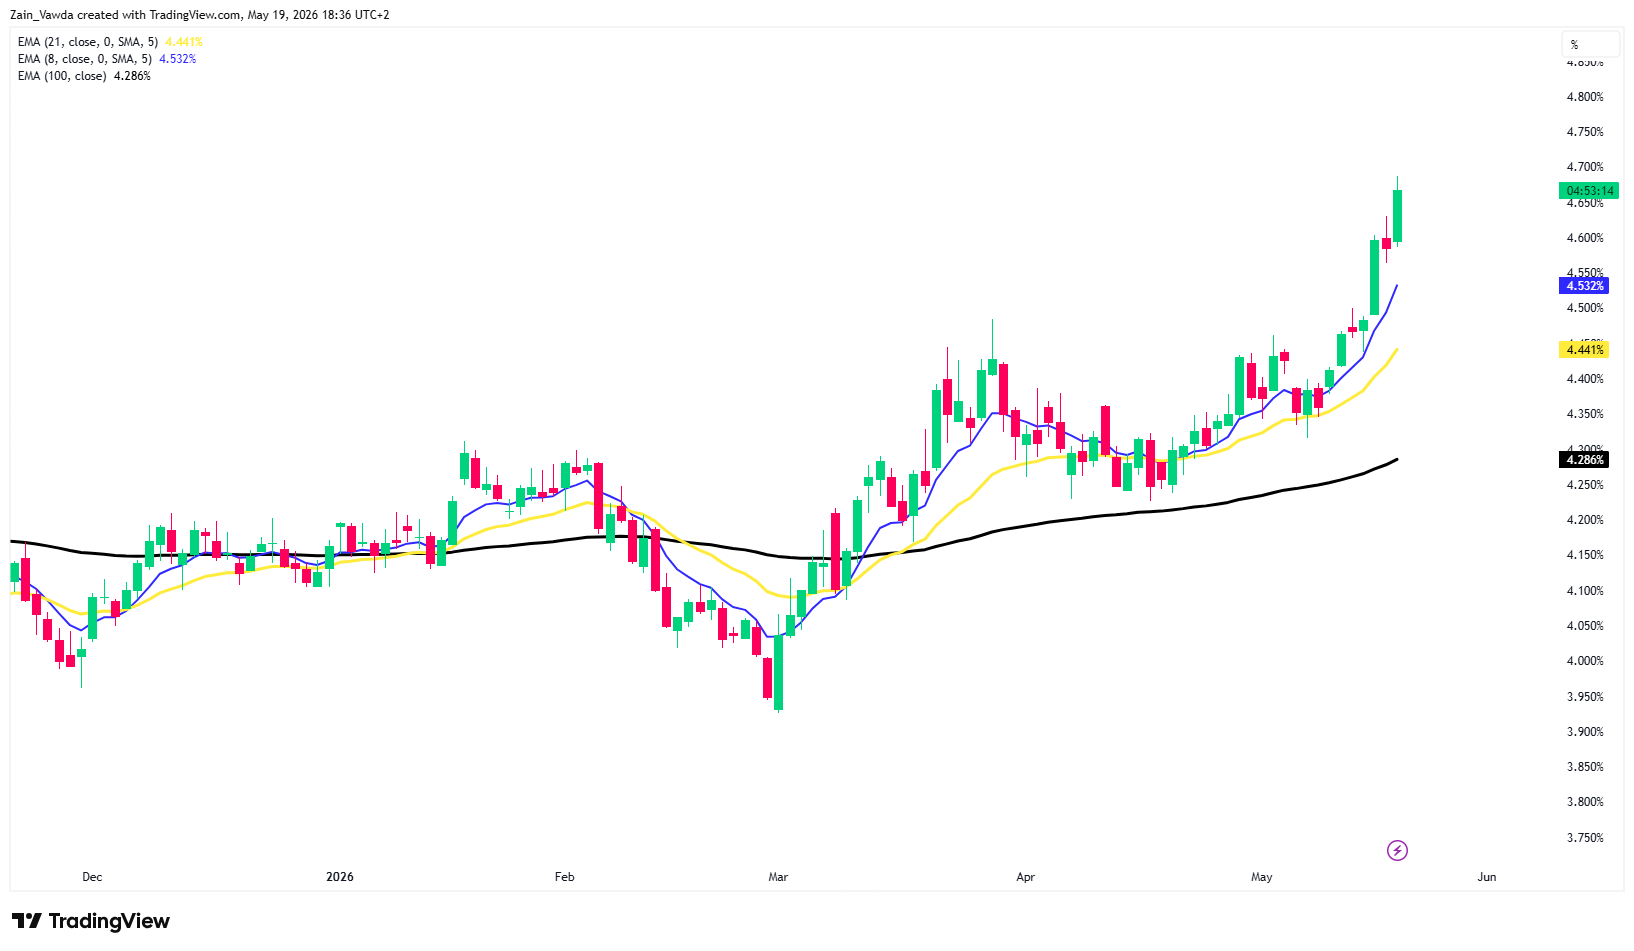
Source: TradingView
Concurrently, the long end of the curve is flashing massive shifts, with the 30-year yield creeping higher alongside global counterparts (such as the Japanese 30-year hitting multi-decade highs). The US 30Y note yield hit its highest level since 2007.
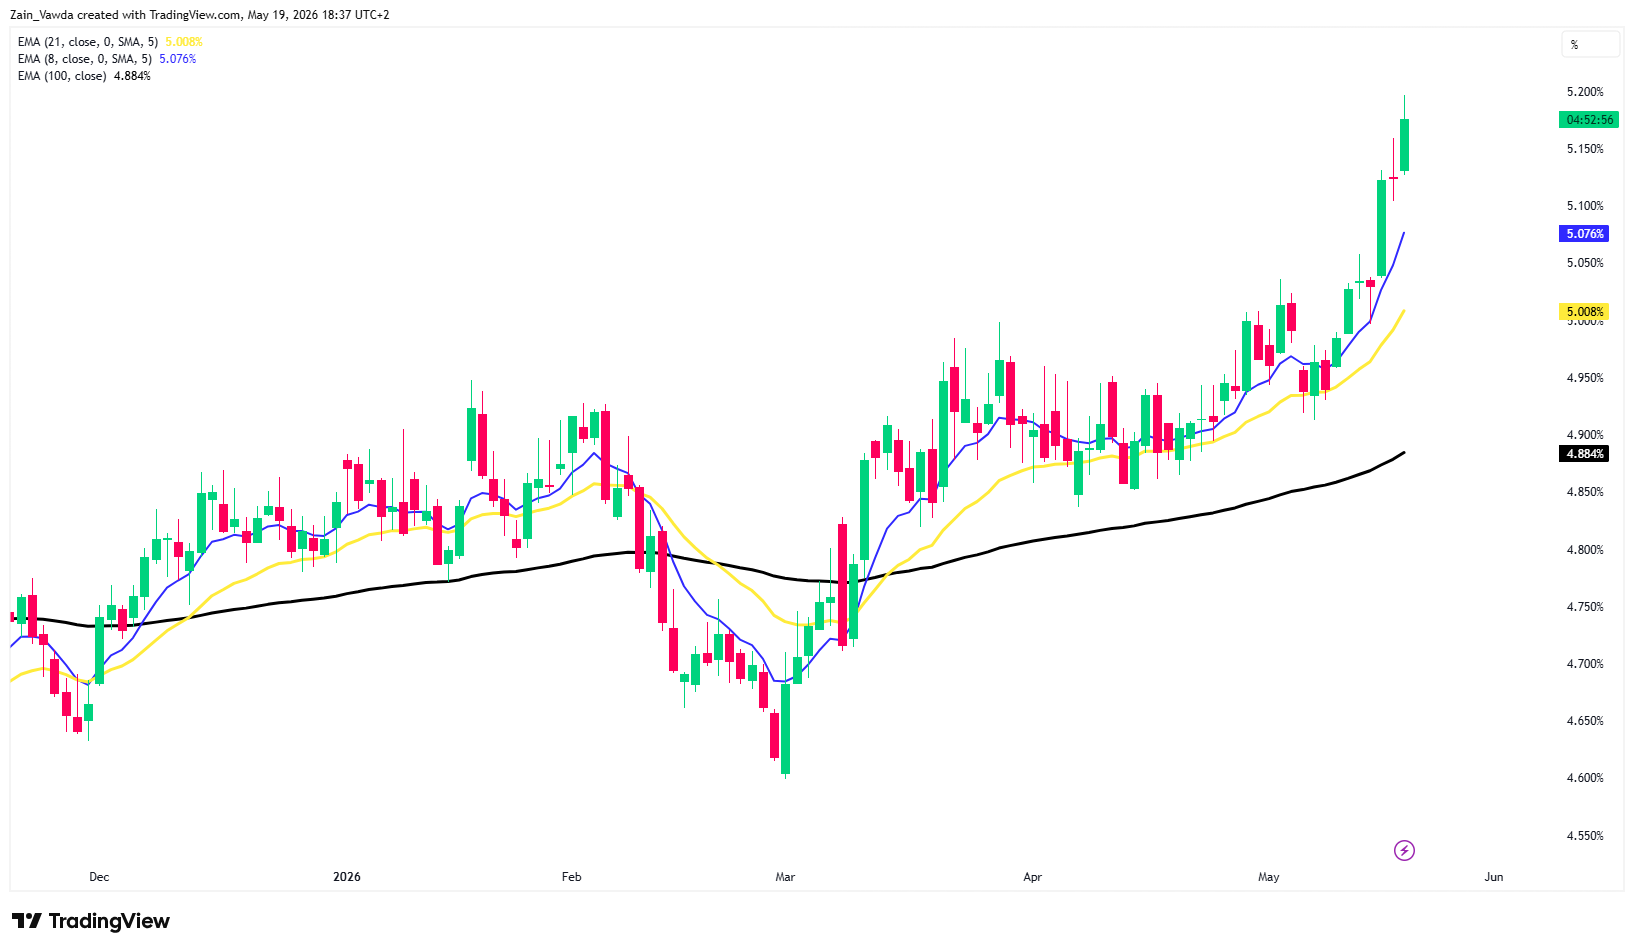
Source: TradingView
Why is this happening?
Before the conflict with Iran, US interest rates were finally falling after years of high inflation. The 10-Year Treasury yield had dropped to 3.92%. However, just 80 days later, it has jumped by 0.75%, a massive and rapid move for the bond market.
Initially, the rise in yields was limited because most people expected a short war and assumed the critical Strait of Hormuz shipping lane would stay open. Instead, both the US and Iran have blocked the Strait, cutting shipping traffic to nearly zero. With oil prices stuck above $100 a barrel for almost two months, high inflation has returned. US producer prices (PPI) are up 6.0% and consumer prices (CPI) are at 3.8%, marking their highest levels since 2023. To protect themselves from this shrinking purchasing power, lenders are demanding higher long-term interest rates.
We are now experiencing the worst inflation since the post-pandemic recovery. Since the war began, jet fuel has surged 58%, gasoline is up 52%, and fertilizer has climbed 20%. These skyrocketing energy and agriculture costs are now bleeding into everyday consumer prices. This pattern looks increasingly like the late 1970s, when a second, unexpected spike in oil prices triggered a massive wave of inflation just as the economy seemed to be recovering.
These sticky yields signal that the market is positioning for a "higher-for-longer" inflationary backdrop, forcing market participants to weigh potential hawkish pivots from central banks.
Earlier in the day swap markets implied around an 80% probability of a Federal Reserve rate hike by year-end 2026.
A Stronger US Dollar (DXY)
The factors driving the US Dollar higher have returned. As market participants chase high US interest rates, the dollar has strengthened globally. Because gold is priced in dollars, a stronger greenback automatically makes it more expensive for international buyers. This math, combined with market participants selling to lock in cash, is exerting fresh downward pressure on gold prices.
Outlook Moving Forward
Looking ahead and the saving grace for Gold bulls could still arrive in the form of a US-Iran peace deal. The implications of such a deal would have a knock on effect on things like inflationary pressure and thus US Dollar strength among others.
Such a move could be the catalyst needed for bulls to take charge and eye the $5000 handle and beyond. For now this is what is keeping market participants on edge and the bears at bay from a sustained push lower.
Technical Analysis - Head and Shoulder Pattern in Play
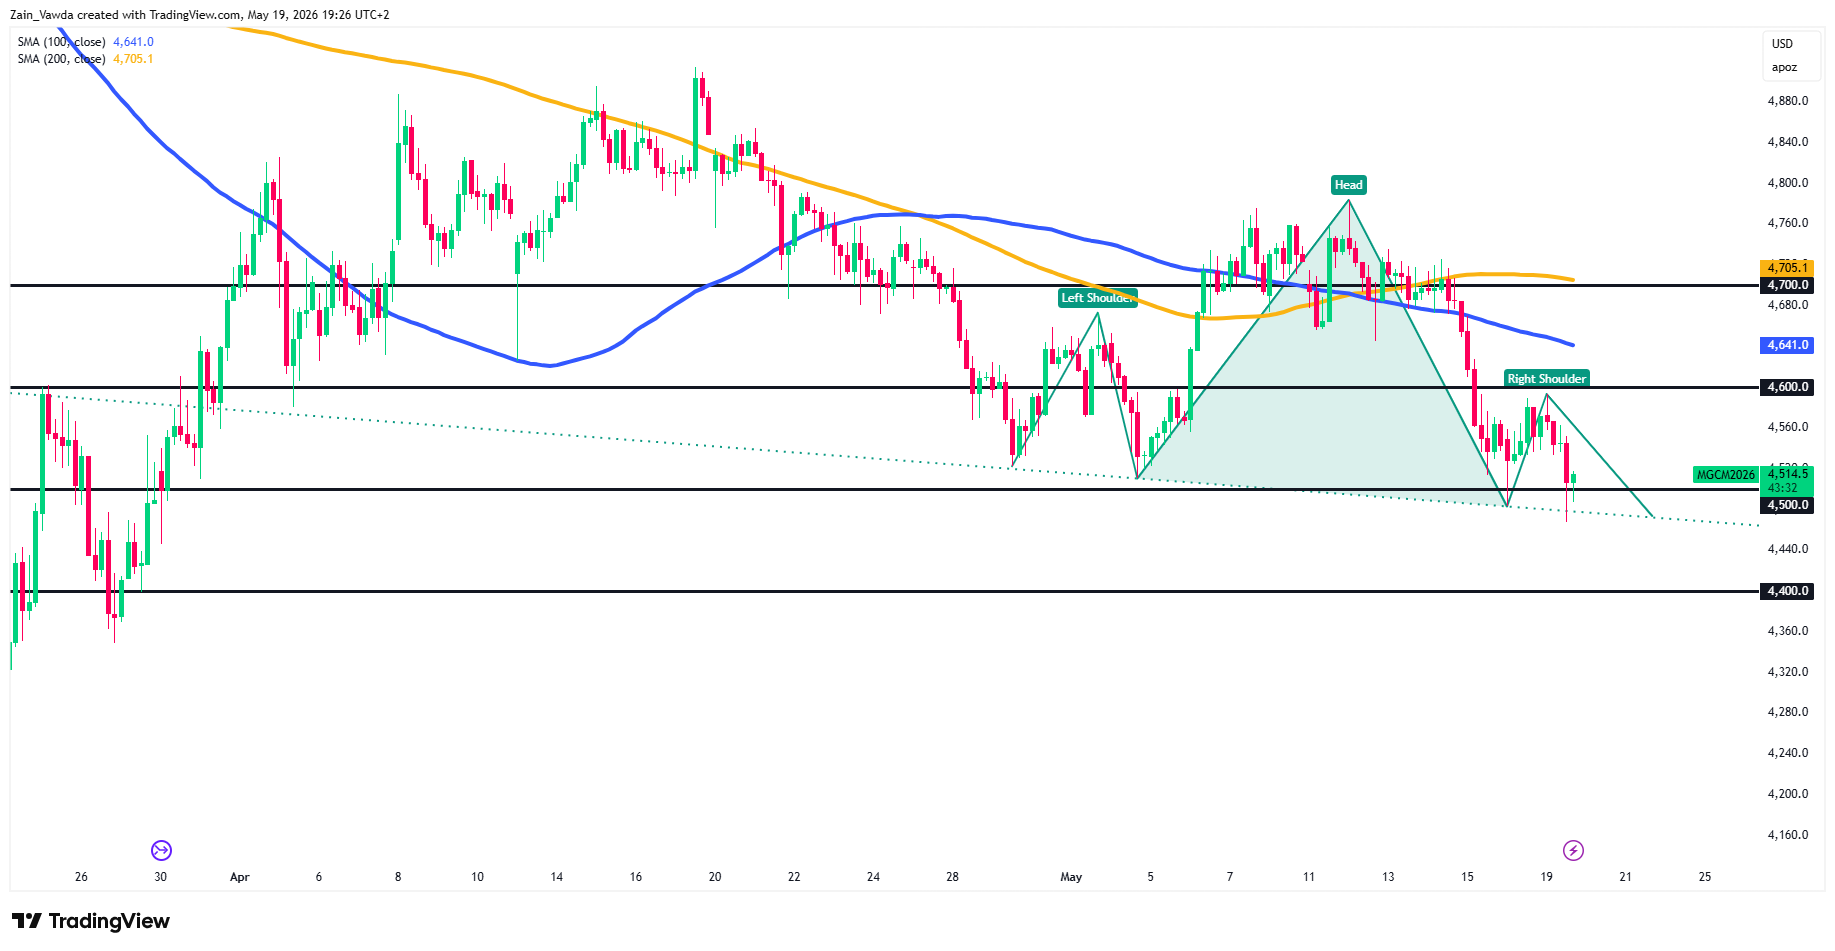
Following up on the intense macro pressures facing the precious metal today, the daily chart for Micro Gold Futures (MGCM2026) reveals a distinct shift in technical momentum.
The most striking feature on the chart is the completion of a classic Head and Shoulders (H&S) pattern.
Gold (MGC1) Four-Hour Chart, May 19, 2026
Source: TradingView
The next step would be a four hour candle close below the neckline, which rests around the 4477-4470 handles respectively.
Gold has also failed to record a four-hour candle close below the psychological 4500 handle. If bears are to take control, the two conditions above will need to be fulfilled.
Failure to do so could lead Gold to a dead cat bounce higher with immediate resistance resting at 4533 before the recent highs at 4590 come into play. A four-hour candle close above this level would invalidate the bearish narrative.
Read Next: Nasdaq 100 Sits Just Off All-Time Highs With Nvidia's Q2 Print Set to Make or Break the Next Move


