
A duo of reports released Thursday painted a fairly strong picture of the U.S. economy despite the surrounding headwinds, including a war in the Middle East, which has stifled the oil supply chain.
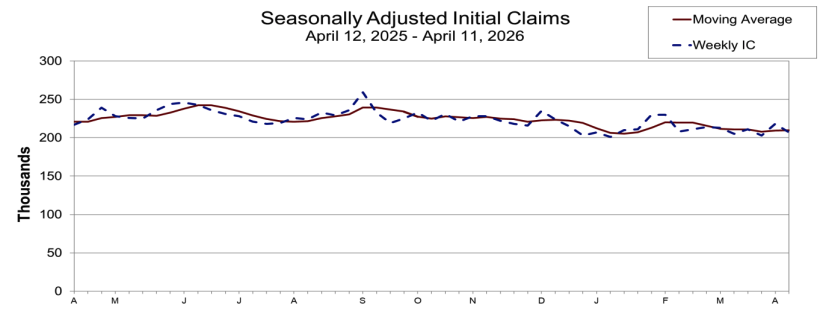
Jobless Claims Fall: The number of individuals claiming unemployment benefits for the first time fell to 207,000 in the week ended April 11, from a revised reading of 218,000 for the previous week, according to a Labor Department report. Economists had expected claims to fall to 213,000 from the initially reported 219,00 for the previous week.
Jobless Claims (Seasonally adjusted)
Source: Labor Department
The four-week average, which smooths out fluctuations, was 209,750 , compared to the previous week’s 209,250.
Continuing claims, calculated with a week’s lag, climbed 31,000 to 1.818 million in the week ended April 4 from the downwardly revised reading of 1.787 million for the previous week. This metric measures the individuals who have already filed an initial unemployment claim and continue to receive benefits.
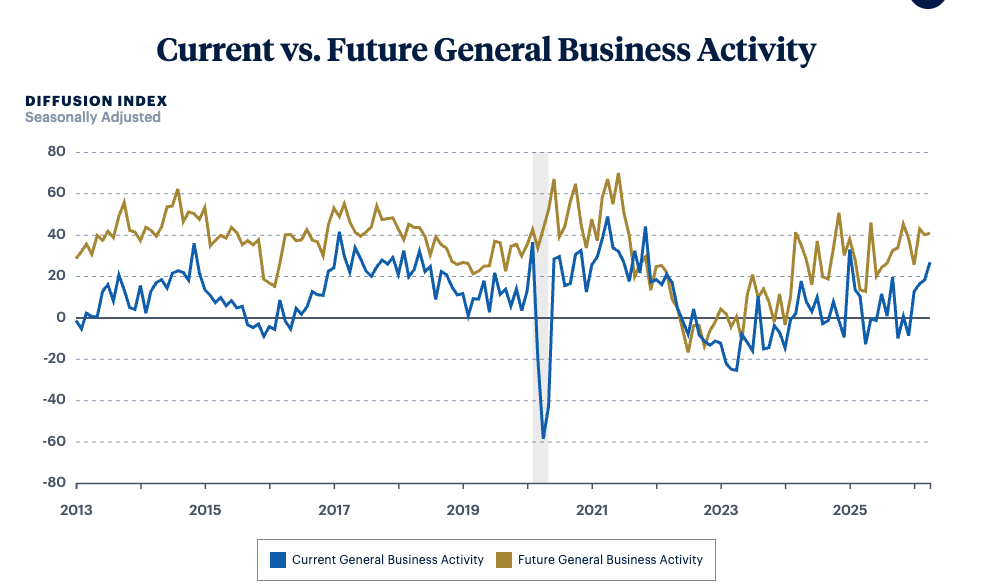
Manufacturing Activity Gains Ground: The Philadelphia Fed’s April survey results showed that the diffusion index of current general business activity jumped to 26.7 from 18.1 in March. Thus, the index extended its rising streak to four months. Economists, on average, had expected, a reading of 10.3 for the month.
Among the other current indicators:
- New orders jumped 24 points to 33.
- Shipments climbed 12 points to 34.
- Employment, however, fell 6 points to -5.1.
- Average workweek rose 4.9 points to 7.7.
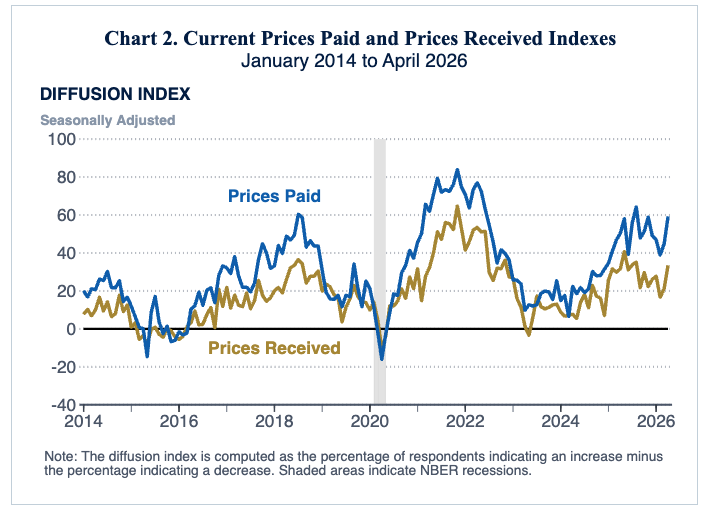
- Prices paid climbed 15 points to 59.3.
- Prices received increased 12 points to 33.5.
Both price indices remained well above their long-run non-recession averages, and climbed to their highest since August.
Price Indices
Source: Philadelphia Fed
The diffusion index for future general activity edged up to 40.8, although future new orders and shipment indices declined. While the future prices paid fell 3.5 points to 50.2, the prices received index rose 11.8 points to 50.2.
Manufacturing activity in New York grew at a faster rate in April, according to the Empire State survey released on Wednesday. However, there were some red flags, including decelerating future business conditions index and strong growth in prices paid, signaling an inflationary trend.
General Business Activity (Current Vs Future)
Source: Philadelphia Fed
How Market Reacted to Data: The S&P 500 E-mini futures (ES) contract, which was trading with a modest advance ahead of the data, held its gains. The 10-year U.S. Treasury note futures (ZN) also sustained its marginal gain, while yields slipped. The slim rate cut odds factored in by traders, according to the CME FedWatch Tool, rose slightly to 1.6% from 1% on Wednesday.
Read Next: UK GDP Jumps in February, but Economist Doubts Bank of England Will Raise Rates This Year