
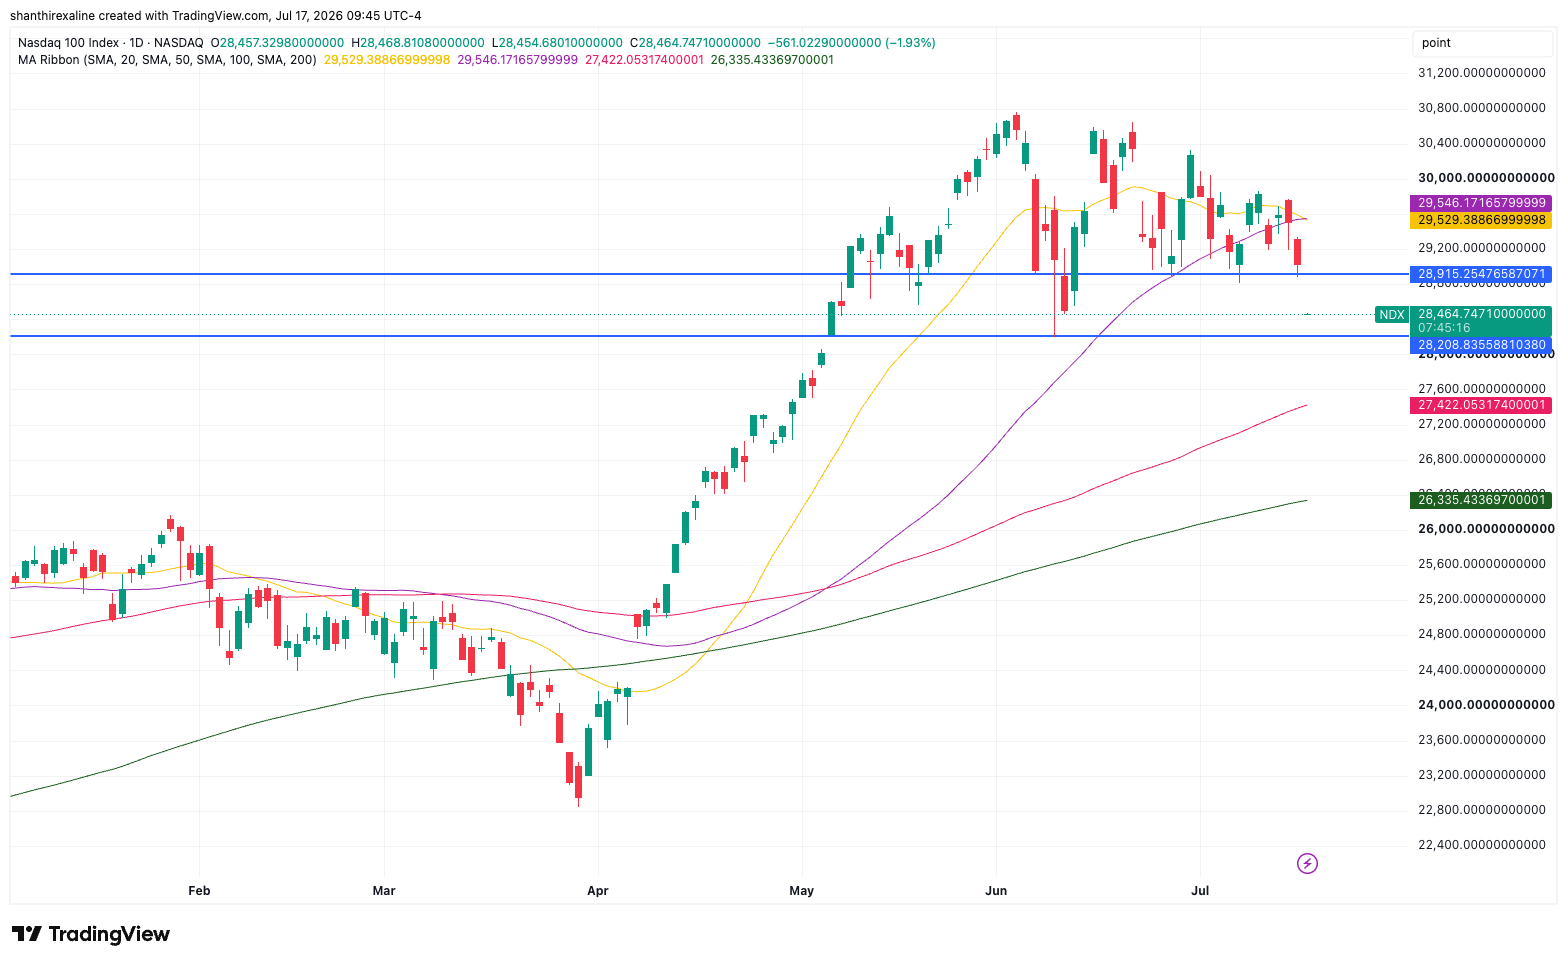
The Nasdaq 100 has quietly become the weakest link among the major U.S. equity benchmarks this week, lagging the S&P 500, the Dow, and even the small-cap Russell 2000 as investors rotate out of richly valued AI and semiconductor names. That underperformance has pushed the index to the doorstep of a technical level that could define trading for the next two weeks: 28,200.
NDX Vs. Dow Vs SPX Vs. R2K: How Returns Compare
| Week-to-date Change | Year-to-date Change | 1-Year Change | |
|---|---|---|---|
| Nasdaq 100 | -2.7% | +15% | +26.7% |
| Dow | -0.2% | +9.3% | +18.8% |
| S&P 500 | -0.6% | +10.1% | +20.3% |
| Russell 2,000 | -0.1% | +19.9% | +33.6% |
NDX’s gap of roughly 2.5 points against the small-cap benchmark alone is notable because Russell 2000 typically has higher beta and would be expected to fall further in a genuine risk-off week. Instead it's barely moved, suggesting this pullback is concentrated in mega-cap AI/semiconductor namesrather than a broad market de-risking.
Zooming out, the longer-term picture is the opposite story: NDX still leads the S&P 500 and the Dow both a YTD and 1-year basis, meaning this week's move reads as a valuation gut-check within a strong uptrend, not the start of a broader breakdown — though it does raise the stakes for whether 28,200 holds and how Alphabet's earnings land next week.
The pattern behind the number
Since printing an all-time high on June 3, the Nasdaq 100 has carved out what looks like a head-and-shoulders top, with the neckline around 28,915–29,000 — the trough between the head near 30,800 and the right shoulder near 30,400. That neckline has already given way: NDX is now trading at around 28,675, down more than 1% on the session. The next support shelf sits at 28,200, and a confirmed close below that would open the door toward the 100-day SMA at 27,422, with further downside possible if the AI-valuation reassessment continues. On the upside, a reclaim of the 28,915–29,000 neckline zone would go a long way toward invalidating the breakdown and shifting the structure back toward consolidation.
According to MarketFramework's Positioning Edge tool, traders with a track record of profitability are running slightly longer on the Nasdaq E-Mini (NQ) than their unprofitable counterparts. That tilt is worth noting given the index's proximity to the 28,200 support level — it suggests that at least some well-positioned participants are treating the current pullback as a buyable dip within the broader uptrend rather than the start of a deeper breakdown. That said, the skew is modest, not a decisive signal, and could shift quickly
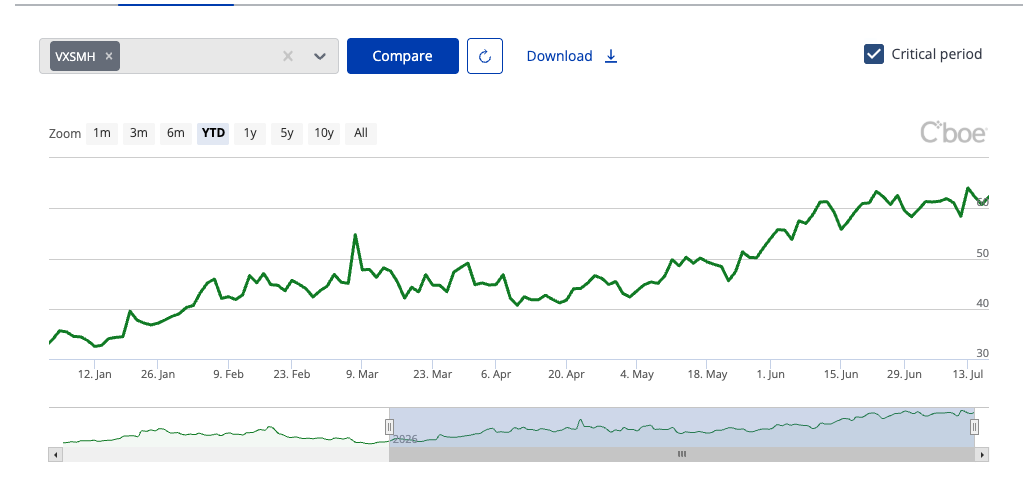
It isn't only price action flashing caution. The PHLX Semiconductor Index has broken below its own 50-day moving average and the realized volatility in chip stocks expands. This combination raises the odds of a negative feedback loop into the Nasdaq 100, given how heavily the index is weighted toward semiconductor and AI-infrastructure names. That's the mechanical link between the "chips are being repriced" story that's dominated headlines all month and the index-level technical picture now taking shape.
CBOE Semiconductor ETF Volatility Index
Source: CBOE
What's driving the rotation
The move isn't happening in a vacuum. Investors are increasingly questioningwhether current valuations for AI-driven chipmakers still justify the sector's growth expectations, even as several of those same companies continue to post strong headline results — a dynamic that has repeatedly punished "beat but not enough" earnings this season.
Layer on top of that a fresh wave of geopolitical risk, with Iran reporting new strikes on U.S. facilities in the Middle East, including a first direct hit in Syria, after a sustained run of U.S. strikes on Iranian military sites. Rate-sensitive, high-multiple tech names are typically the first to feel pressure when oil and geopolitical risk premiums rise together. Adverse reaction to Netflix's forward guidance also added to the negative sentiment on Friday.
The catalyst that could resolve it early
Normally a level like 28,200 might take days or weeks to resolve on price action alone. This time, there's a specific event that could force the issue well before any slow technical grind plays out: Alphabet reports second-quarter earnings on Wednesday, the first of the Magnificent Seven to report since the current selloff accelerated.
As a bellwether for cloud and AI-infrastructure spending, Alphabet's commentary on capex plans and monetization progress will land squarely on the question investors are already asking about every other AI-exposed name in the index. A reassuring print could do more to stabilize the Nasdaq 100 than any technical bounce off support; a disappointing one could be the push that sends the index through 28,200 before the week is out.
Behind Alphabet, the calendar keeps the pressure on: Microsoft and Meta are both due to report on July 29, the same day the Federal Reserve delivers its next rate decision, with Apple and Amazon following on July 30.
Two ways this plays out
Breakdown case: A daily close below 28,200 confirms the double top and shifts focus toward 27,422 as the first real support test, with the index's 200-day moving average as a deeper downside target if selling pressure builds into the following week's Fed meeting.
Stabilization case: If 28,200 holds and Alphabet delivers reassurance on AI spending discipline, the setup could resolve as just another leg within the broader corrective range the Nasdaq 100 has traded in since June — consistent with an index that remains, technically, inside a longer uptrend dating back to the April lows.
The next few sessions may be driven less by gradual market moves and more by the combination of a key chart level and a major earnings catalyst. A strong or weak earnings report could quickly trigger the stock's next significant move.


