Markets don't hand out easy money at all-time highs but they do hand out traps for the underprepared.
Right now, ES and NQ are sitting near record territory after one of the sharpest recoveries in recent memory, and futures traders are facing one of the trickiest environments to navigate: a bull market that looks strong on the surface, but increasingly fragile underneath.
The question isn't whether to trade it. The question is how.
How We Got Here
To understand the opportunity and the risk you need to understand the context.
The S&P 500 has now logged eight consecutive weeks of gains, its longest winning streak since late 2023. NQ staged a near-vertical recovery from its March and April lows, driven by a combination of AI momentum, strong tech earnings, and a shift in geopolitical sentiment when a temporary U.S.-Iran ceasefire triggered a massive relief rally in early April.
The macro backdrop that fueled the move: AI spending cycles showing no signs of slowing, Q1 earnings that beat diminished expectations at an 84% rate, and Treasury yields cooling from their earlier peaks. On a pure price basis, the tape looks powerful. But look under the hood, and cracks appear.
The Breadth Problem
Here's the core tension every S&P and Nasdaq trader needs to understand right now: the indexes are at all-time highs, but the average stock is not.
A healthy trending market typically sees 60–70% of constituent stocks trading above their key moving averages and participating in the advance. What we are seeing in May 2026 is something far more concentrated, a narrow band of AI mega-caps carrying the index higher while small-cap and mid-cap names lag significantly.
The Russell 2000 has been a consistent underperformer, a classic signal of risk aversion hiding beneath the headline numbers.
This matters directly to futures traders because:
S&P500 (ES) is cap-weighted. When NVIDIA, Microsoft, and a handful of other mega-caps print strong earnings, the index moves even if hundreds of names don't. That creates an illusion of broad strength.
Nasdaq (NQ) is even more concentrated. The top ten names in the Nasdaq 100 represent a disproportionate share of the index's daily movement. Nasdaq can rip while 70% of its components go nowhere.
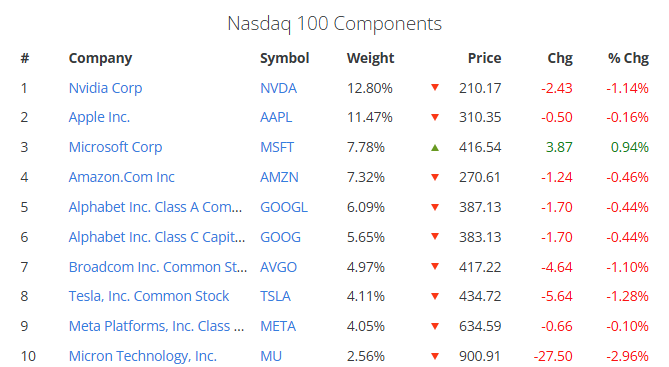
Source: Slickcharts
Dips in low-breadth rallies can be air pockets. Without broad participation supporting price, selling pressure doesn't find the cushion it would in a healthier market. What looks like a pullback opportunity can accelerate into a deeper correction before buyers step back in.
The takeaway: at record highs with narrow breadth, you cannot treat every pullback the same way you would in a broad-based trending market.
Reading Nasdaq (NQ's) Current Setup
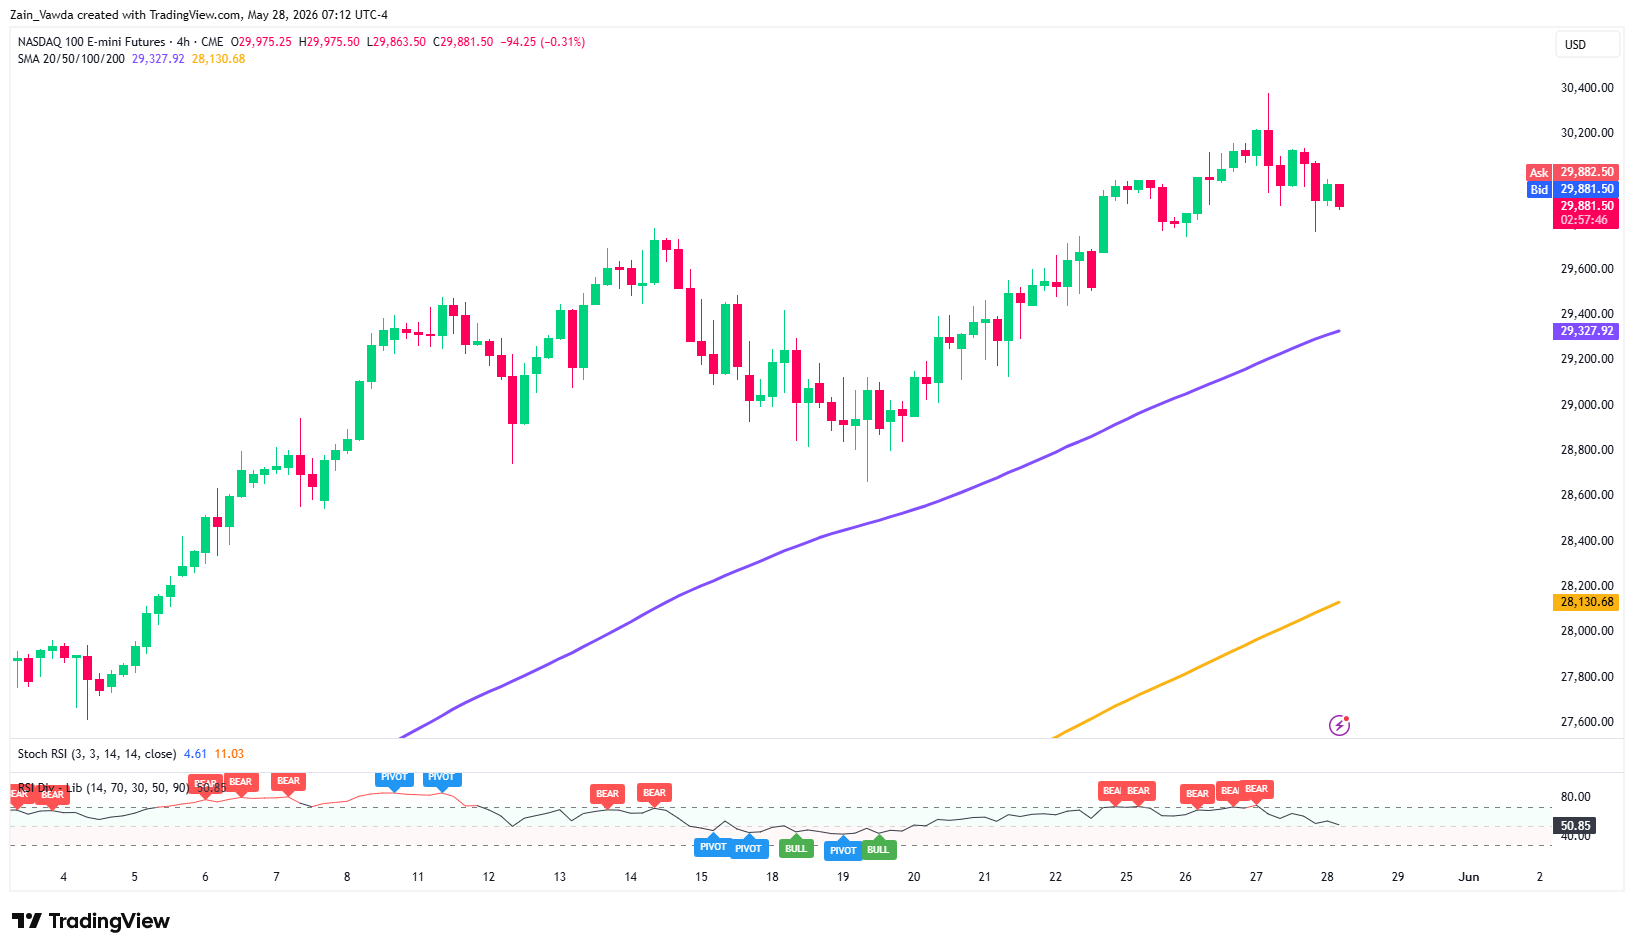
Nasdaq (NQ) staged a powerful V-shaped recovery from the April lows, fully reclaiming all-time highs. The momentum has been undeniably strong as buyers have defended every small intraday pullback.
But the most recent technical picture is flashing a caution sign: bearish divergence on the MACD. Even as price has made new highs, the MACD histogram has turned red for the first time since April. That means momentum while still positive is decelerating. Price is running ahead of what the internals can confirm.
This is not a sell signal on its own. In strong momentum environments, divergences can persist for weeks before they resolve. But it does reframe how you approach entries.
The RSI period-14 is also in overbought territory for the last 6 weeks or so. This further strengthens the belief that a pullback may be on its way.
Nasdaq 100 (NQ1!) Daily Chart, May 28, 2026
Source: TradingView
The 100-day MA (Purple Line) rests at 29,327.92 and the yellow 200-day MA at 28,130.68 are both sloping upward, confirming that the macro trend remains highly bullish.
Expect further consolidation. If local support holds, a bounce toward 30,000 is likely; a break lower eyes the purple MA at 29,327 as a prime buy-the-dip zone.
Reading S&P500 (ES's) Current Setup
The S&P 500 E-mini Futures is almost a mirror image of the Nasdaq 100.
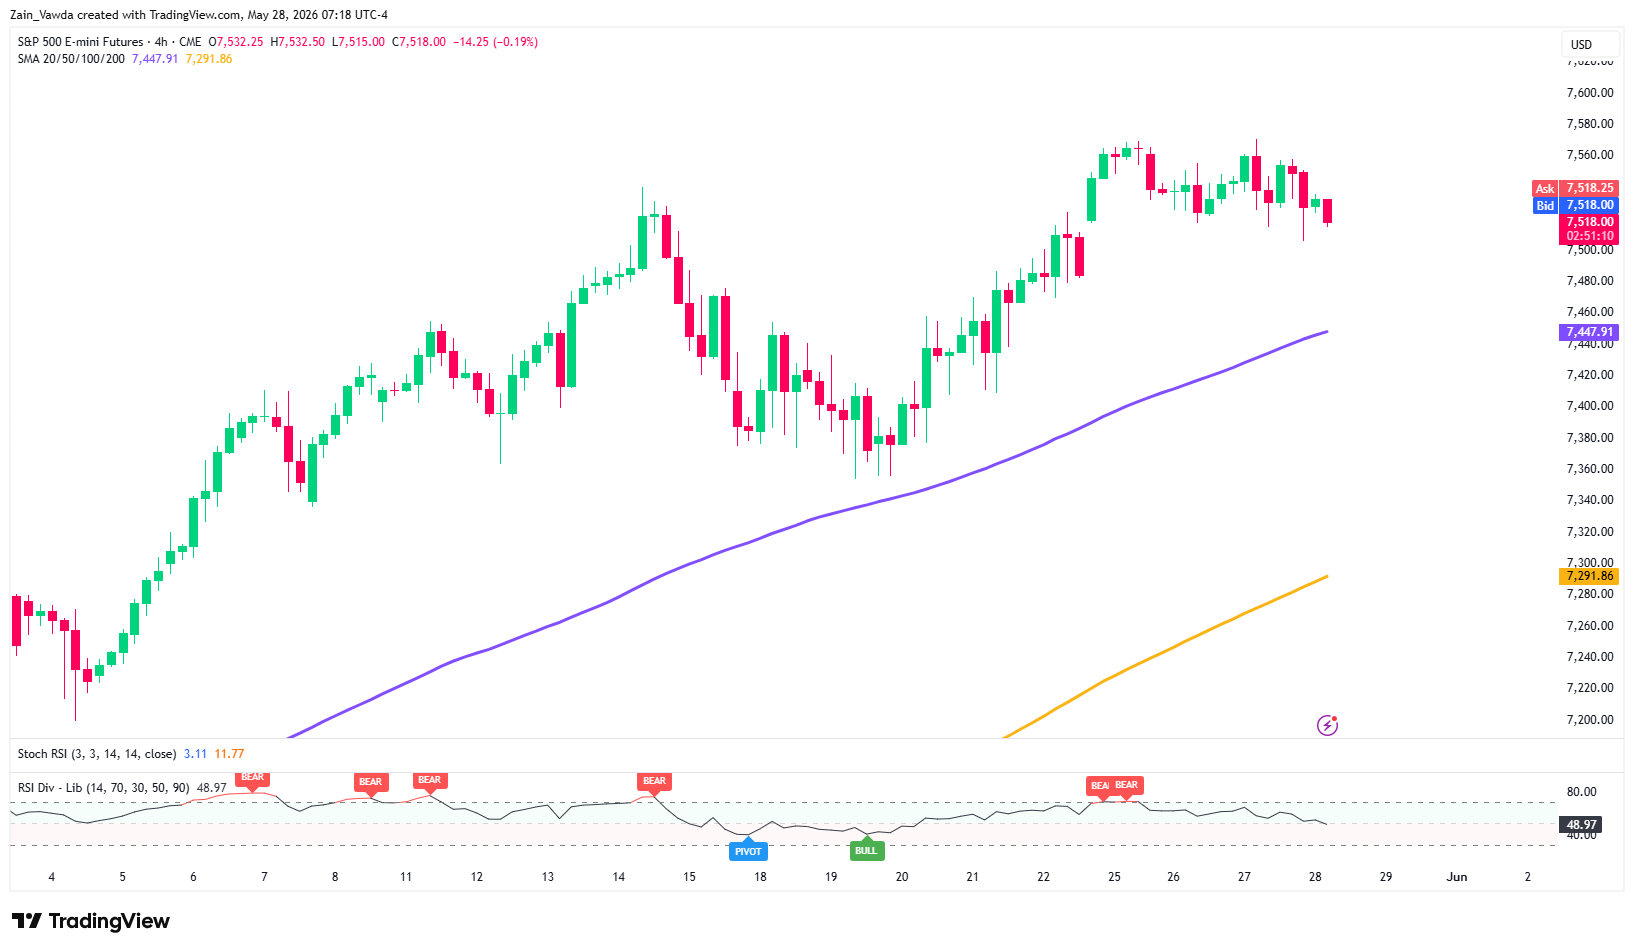
S&P 500 (ES1!) Four-Hour Chart, May 28, 2026
Source: TradingView
After topping out near 7,560, the index has drifted sideways-to-lower, printing minor lower highs. The market is currently trading around 7,518.00, finding near-term support just above recent swing lows.
The broader trend remains decisively bullish. The purple 100-day MA sits at 7,447.91, and the yellow 200-day MA is at 7,291.86; both are sloping upward, indicating solid institutional backing on longer timeframes.
A brief consolidation period is underway. If buyers defend the current area, a retest of 7,560 is likely. A deeper drop will find strong support at the purple MA (7,447.91).
What Makes a Pullback a Real Opportunity?
This is a very important question in the current market environment. It is important to understand that not all pullbacks are created equal.
Here's the potential framework for distinguishing a buying opportunity from a falling knife in this environment:
Signs a Pullback Is a Buy
- Price pulls back to a prior breakout level that has been retested and held at least once
- The pullback occurs on declining volume, sellers are not pressing hard, just profit-takers exiting
- The broader macro catalyst driving the dip is temporary or event-driven (e.g., a single geopolitical headline, a short-term inflation print)
- Price action forms a clear higher low on the intraday chart before reclaiming structure
Signs a Pullback Is Something More
- The pullback accelerates on increasing volume institutional selling, not just rotation
- Price loses a key support level on a daily close, not just an intraday wick
- Breadth deteriorates sharply, advancers collapse, declining issues surge
- VIX spikes above 20 and holds, signaling genuine fear rather than a controlled shake
- The macro trigger is sustained. (e.g., a structural shift in Fed policy expectations, not just one data point).


