
Gold has turned sharply lower. After climbing back toward $4,500 earlier this week, the metal dropped about 2% on Friday, sliding to around $4,400 an ounce in the minutes after the U.S. jobs report landed.
In a single move it handed back the gains made on Thursday, when dovish comments from a Fed official had lifted it close to $4,510.
Why Gold Reversed
The trigger was a much stronger jobs report than anyone expected. The logic behind the drop is simple, with markets adding to rate hike bets for the Federal Reserves upcoming September meeting.
Markets saw rate hike bets rise from 49% on Thursday to post 60% after the NFP print.
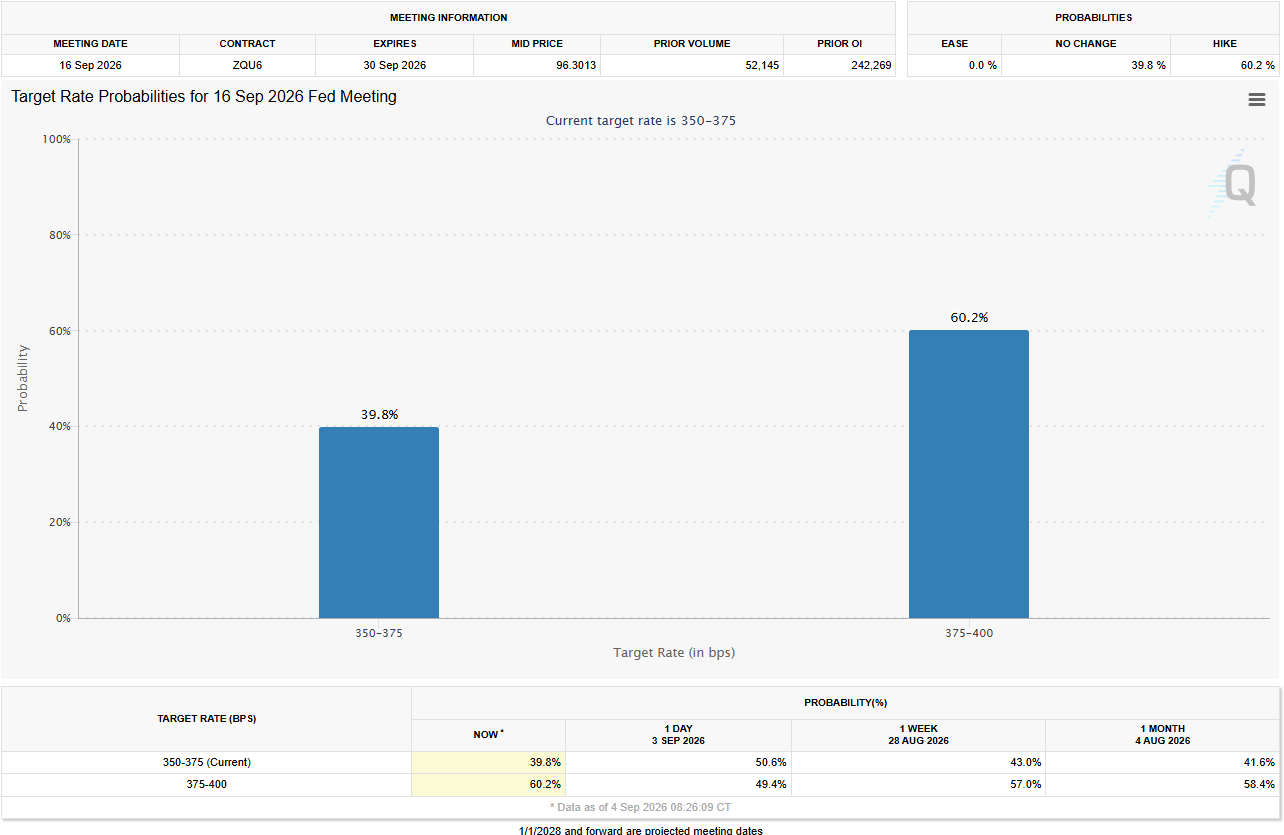
Source; CME FedWatch
The hot jobs report makes a September rate hike look more likely, so yields and the dollar pushed higher and gold fell.
How the Rate-Hike Bet Got Here
The odds of a September hike have swung wildly over the past two weeks. They were low, jumped after Fed Chair Kevin Warsh's hawkish Jackson Hole speech, softened again this week on a weak private-payrolls report and dovish remarks from Fed official Christopher Waller and then firmed back up after today's hot number.
Key Dates and Events
| Date/Event | September Hike Odds |
|---|---|
| Aug 21 — before Jackson Hole | ≈ 40% |
| Aug 28 — Warsh's hawkish speech | ≈ 66% |
| Early this week — soft ADP + Waller turns dovish | Cooled |
| Sep 4 — hot August NFP | Firmed back up to 60% |
The Catch: Wages Didn't Blow Out
Here is the twist. The headline jobs number was strong, but the part the Fed watches most closely for inflation, wage growth was not.
Average hourly earnings rose 3.1% over the year, a touch slower than July's 3.2%. So the report is hawkish (it supports a hike) but it is not the final word.
That matters because Fed officials, including Waller, have said inflation not jobs will settle the September decision. Waller has even suggested a pause is still possible if inflation keeps cooling.
The real test, then, is next week's August consumer price index (CPI), the main inflation report. A hot CPI would lock in the hike case and likely push gold lower. A soft one would revive the "pause" trade and hand buyers a reason to step back in.
Technical Outlook on Gold
Gold's selloff found a floor right where it needed to.
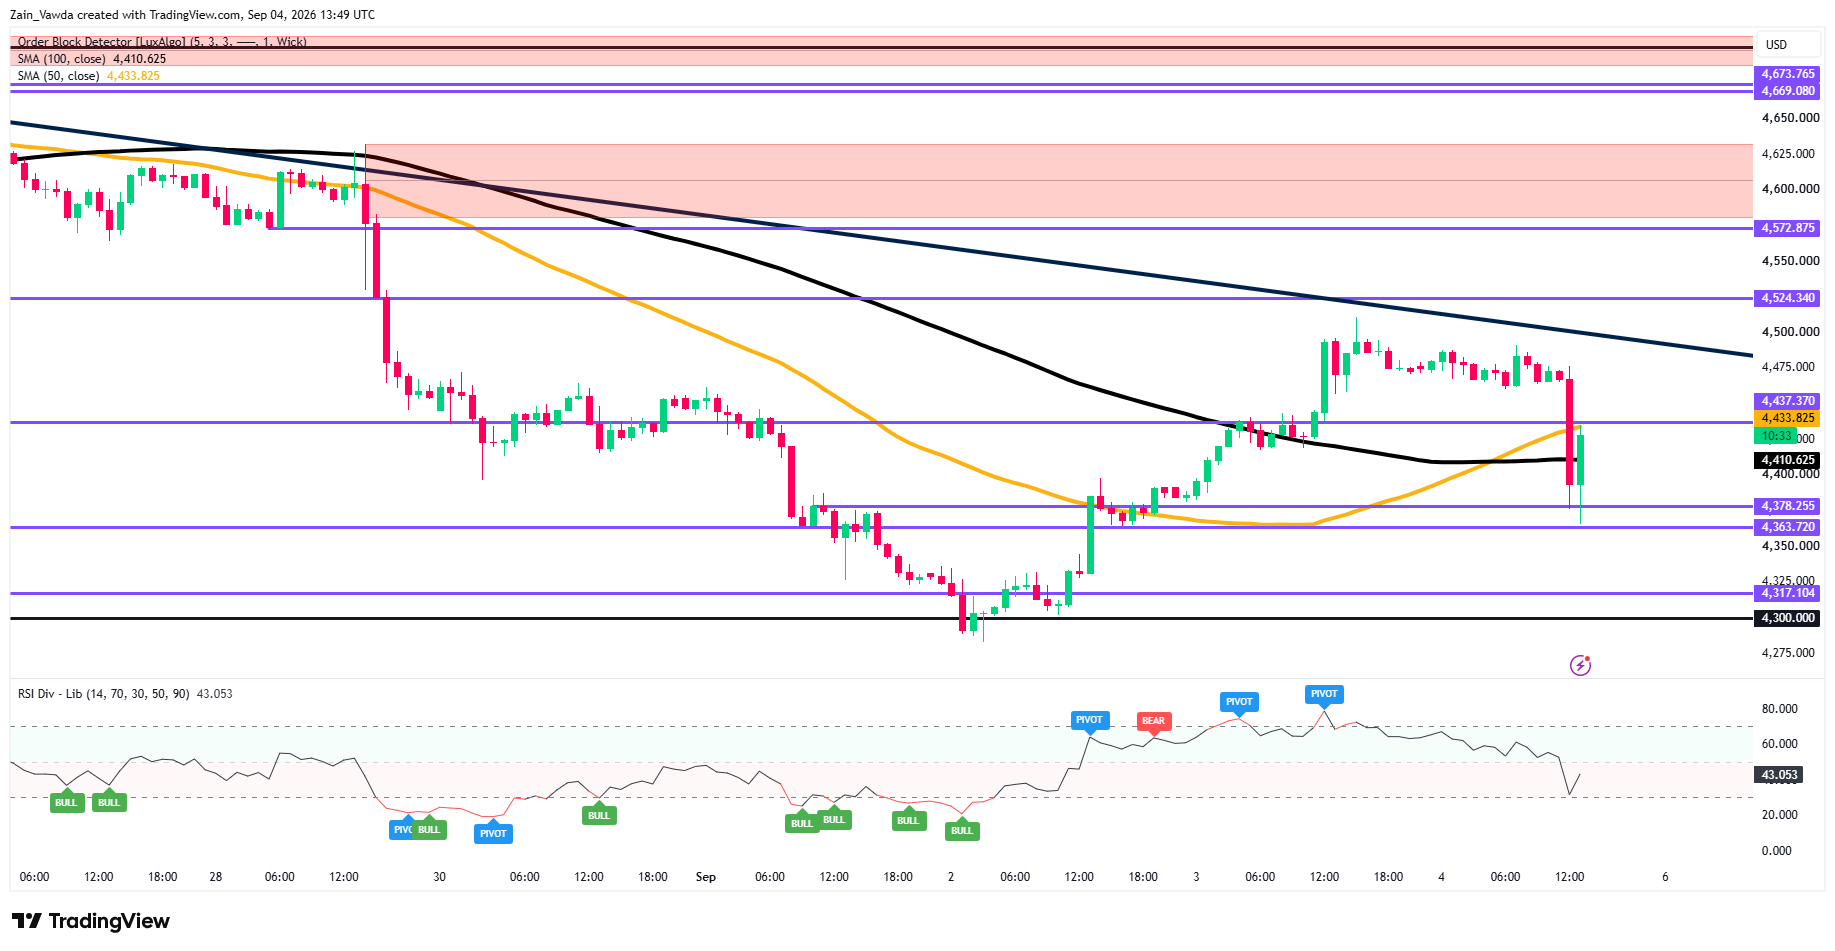
Price tagged the $4,363 shelf, drew in buyers, and snapped back hard reclaiming the 100-period average (~$4,410) and driving into the 50-period average and the $4,437 level.
Gold One-Hour Chart, September 4, 2026
Source: TradingView
The hourly RSI has turned up from oversold (about 30 to ~43), a sign momentum is swinging back toward buyers rather than a one-way slide.
The next test is clear: a clean break and hold above $4,437 opens the broken range at $4,475–$4,500, then the falling trendline from the highs.
Fail there and the bounce risks being a lower high, a slip back under $4,363 reopens $4,325, $4,317 and $4,300.
Bigger picture, gold is still capped by the 200-day average near $4,534 and the supply zone above, so the recovery stays on a leash until buyers clear $4,500.
Trader Positioning Data
Positioning Edge Data flags an extreme bearish divergence. Profitable traders sit 45% long (so 55% short), while unprofitable traders are 58% long, the winners are 14% more short than the losers.
When the smart-money cohort leans short and the crowd leans long, it usually points to downside pressure.
The edge appears to be with the shorts, but thin participation means it's a lean, not a high-conviction signal with Monday being a U.S. holiday it leaves bulls with an intriguing conundrum.


