Silver has long been defined by its dual nature—a monetary hedge in times of uncertainty and a critical industrial component in a decarbonizing world. The metal is once again drawing attention, navigating a complex landscape defined by shifting geopolitical tides, macroeconomic volatility, and a structural supply deficit that refuses to abate.
With silver recently trading in the mid-$70s to low-$80s range, it has retraced from its January all-time highs above $120. The key question facing investors is whether this represents a healthy market consolidation or the early stages of a deeper structural shift in the silver market.
The Macroeconomic Tug-of-War
The current market environment for silver remains inextricably linked to the U.S. dollar and interest rate expectations. Following a period of aggressive gains, the market is currently undergoing a "reassessment phase." Market participants are closely watching the Federal Reserve’s upcoming policy meetings, wary that high real interest rates could keep both gold and silver range-bound in the coming months.
However, the "monetary" argument for silver remains robust. When inflation expectations tick higher, as seen in recent revisions, the metal’s historical function as a hedge against currency debasement comes back into focus. We have seen this play out recently; whenever a macro headwind lifts (such as the recent optimism surrounding geopolitical de-escalation in the Middle East), silver tends to catch a bid faster than gold.
The Gold/Silver Ratio: A Key Signal
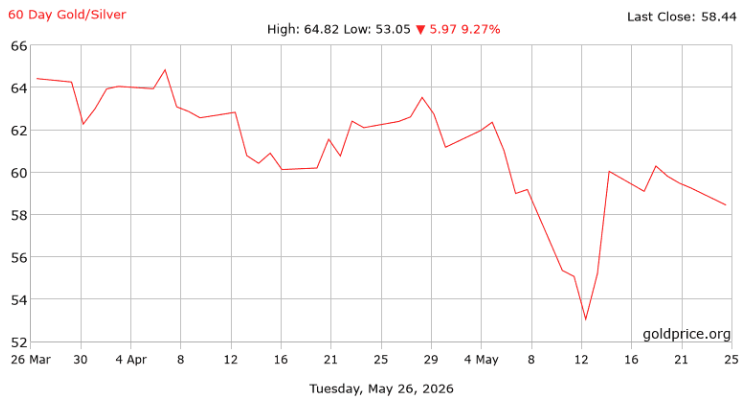
One of the most valuable tools for any precious metal trader right now is the gold/silver ratio. After compressing significantly following U.S.-China tariff-truce extension headlines in early May, the ratio has been hovering in the 55:1 to 60:1 zone.
Source: Goldprice.org
Historically, when this ratio compresses, it suggests that silver is being treated as a high-beta play on precious metals. If the ratio remains below the long-term post-2000 average (60–65:1), it signals that silver is outperforming its "big brother" gold, confirming that market participants are looking for industrial-linked growth rather than just defensive wealth preservation.
Industrial Demand Remains Supportive
While the speculative/monetary side of silver drives volatility, its industrial foundation provides structural support. Despite efforts by solar manufacturers to "thrift" or reduce silver content per panel, the sheer scale of global energy transition projects combined with the massive electricity load requirements of AI data centers, continues to create a persistent demand floor.
We are currently tracking a sixth consecutive year of global supply deficits. When you have a market where demand growth is underpinned by secular trends (EVs, 5G, and renewable energy) and supply remains constrained by the lack of new primary mining projects, the medium-term bias inherently leans in favor of the bulls.
Potential Scenarios and Risk Outlook
As we look toward the remainder of 2026, investors should prepare for two primary scenarios
If interest rates/interest rate expectations remain elevated and the dollar maintains its strength, we could see silver remain range-bound between $75 and $85/oz. This would likely be a period of "basing," where the market absorbs the supply deficit and waits for a clearer signal from the Fed.
Should we see a shift in monetary policy or an escalation in geopolitical uncertainty, the structural deficit could come to the fore. In this scenario, we would expect a sustained test of the psychological $100/oz barrier, with the gold/silver ratio likely moving toward the historical extremes seen in past bull runs.
Key Risks:
Technological: If manufacturers find more efficient ways to substitute silver in solar panels at a faster rate than currently modeled, industrial demand forecasts may need to be revised downward.
The "High-Beta" Trap: Silver’s tendency to outperform in bull markets is a double-edged sword. During periods of broader market liquidity squeezes or risk-off sentiment, silver often experiences deeper, more abrupt corrections than gold.
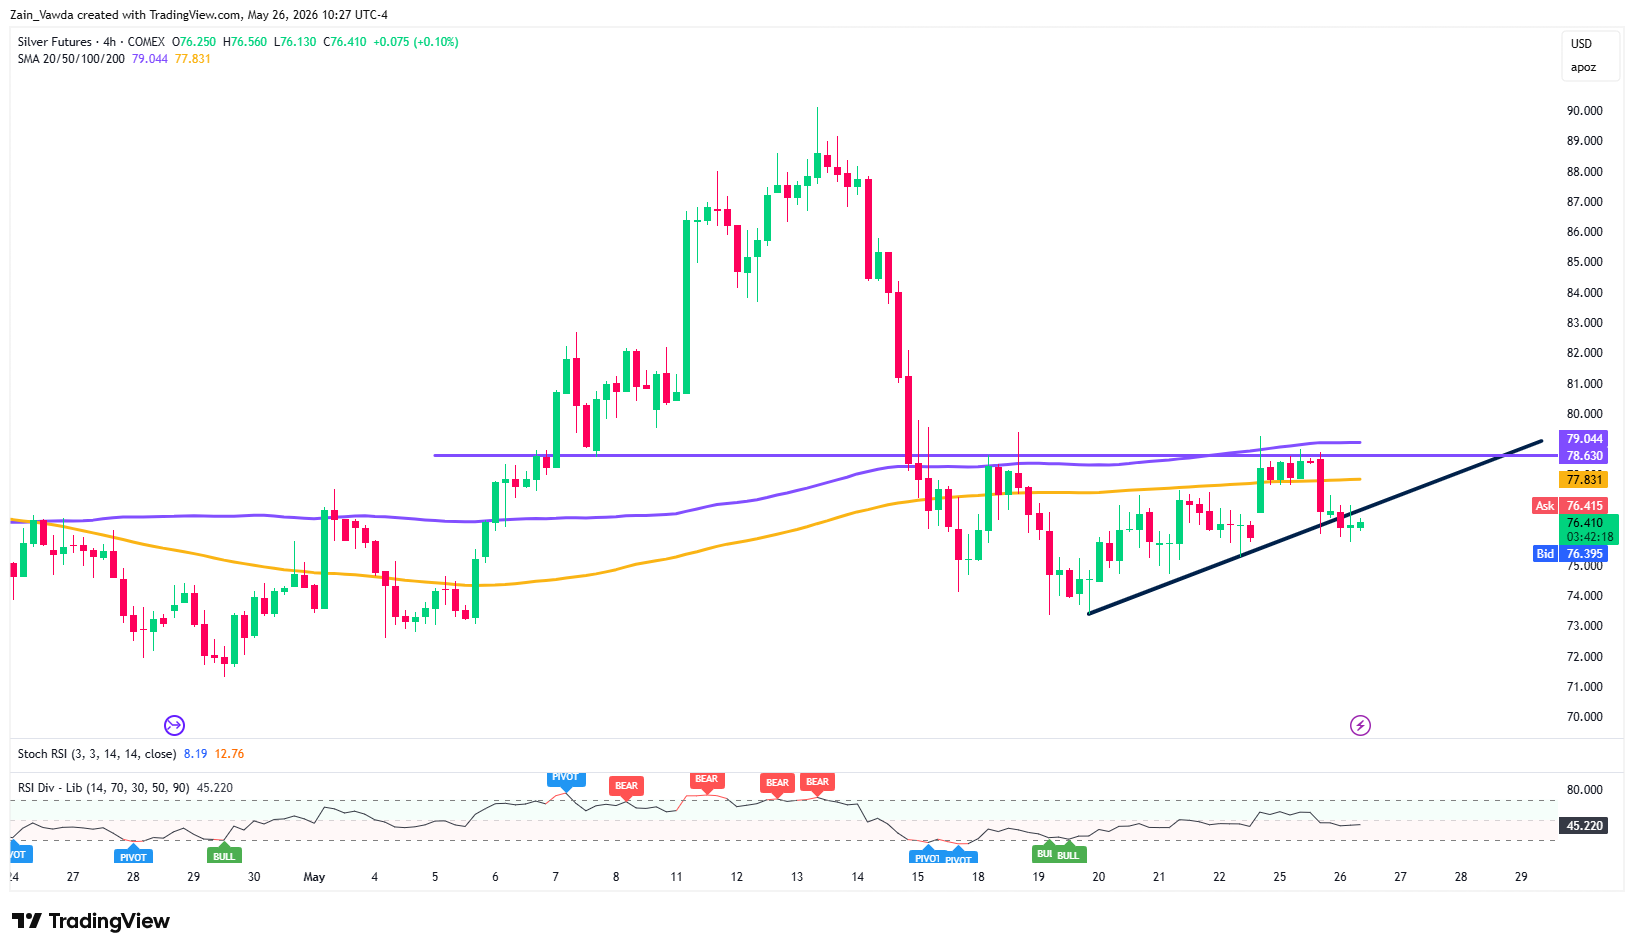
Silver (Sl1!) Four-Hour Chart, May 26, 2026
Source: TradingView
Silver futures on the 4-hour timeframe are currently testing a critical confluence of support.
The price is hovering near the trendline established from the May 20th lows, while the 200-day Moving Average (MA) is acting as dynamic resistance just ahead at $77.83.
A rejection of the 200-day MA could provide an opportunity for would-be bears. This would come at a risk though given the current drop has failed to print a new lower low.
A four-hour candle close above the swing high at $78.63 would invalidate any bearish narrative and could lead to a rally toward the $82.13 and $83.74 resistance levels.


