
Gold has spent two sessions doing exactly what Monday's bull case said it would do, and is spending this morning undoing it.
Spot has slipped back below $4,100 after Wednesday's run to a two-week high, and the reason is not that the war got quieter. It is that the rate market got louder.
The Breakout Lasted Two Sessions
Spot gold is trading around $4,070.80, down roughly 1.3% on the day, after Wednesday carried the metal to $4,142.70 — its highest since July 7.
Silver has given back more, sliding 1.59% to $58.77 after failing at the $60 handle it briefly reclaimed for the first time since July 12.
The move up was real and it was broad. Wednesday's session broke the descending wedge that had capped every rally since the June break. Platinum and palladium came along.
For about thirty-six hours, gold looked like it had finally found the safe-haven bid the headlines had been promising it for three weeks.
Then the Houthis announced a maritime embargo on Saudi shipping, struck two tankers in the Red Sea, Trump promised to destroy an Iranian bridge or power plant for every vessel hit in Hormuz — and gold went down. Again.
The Driver: Our Own Bear Trigger Just Tripped
Monday's note on this page — Gold is Pinned Near $4000/oz — laid out a scenario matrix with a specific bear condition: September hike pricing pushing past 60%. At the time it sat at 56.3%.
It has now gone through that level and kept going. Wednesday's CME FedWatch read was roughly 68%. This morning's prints range from 61% to as high as 78% depending on the source and the hour, with the strip now carrying two 25bp hikes by March 2027. That is a violent repricing in three sessions, and it is being driven by exactly the mechanism flagged a fortnight ago: crude is the transmission belt.
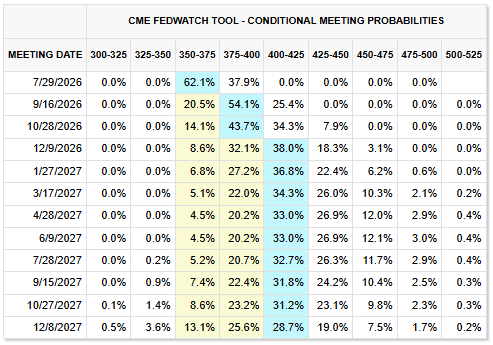
Source: CME FedWatch
Brent is up 4.6% to $98.44 and Crude futures is up 4.4% to $90.60, both at multi-week highs. Higher oil lifts inflation expectations, inflation expectations lift the assumed policy path, the policy path lifts real yields — and real yields are the only variable gold genuinely answers to. The 10-year sits at 4.66%, its highest since May.
This is why the war headlines keep failing to lift bullion. In the current regime, escalation is not a safe-haven input. It is an inflation input, and it routes straight through the front end before it ever reaches the metal.
I feel like we have been doing this dance for a long time now and hate to repeat myself but the underlying drivers have not changed.
Short-Term Outlook: $4,044 Decides It
The near-term picture is unusually clean, because Wednesday's breakout created a level that did not exist on Monday. The wedge resistance at $4,044.40 that rejected price twice last week is now the floor of the breakout.
Hold it and the structure is a genuine base. Lose it and the whole move inverts into a bull trap, which is a far more bearish outcome than never having broken out at all.
Gold Four-Hour Chart, July 23, 2026
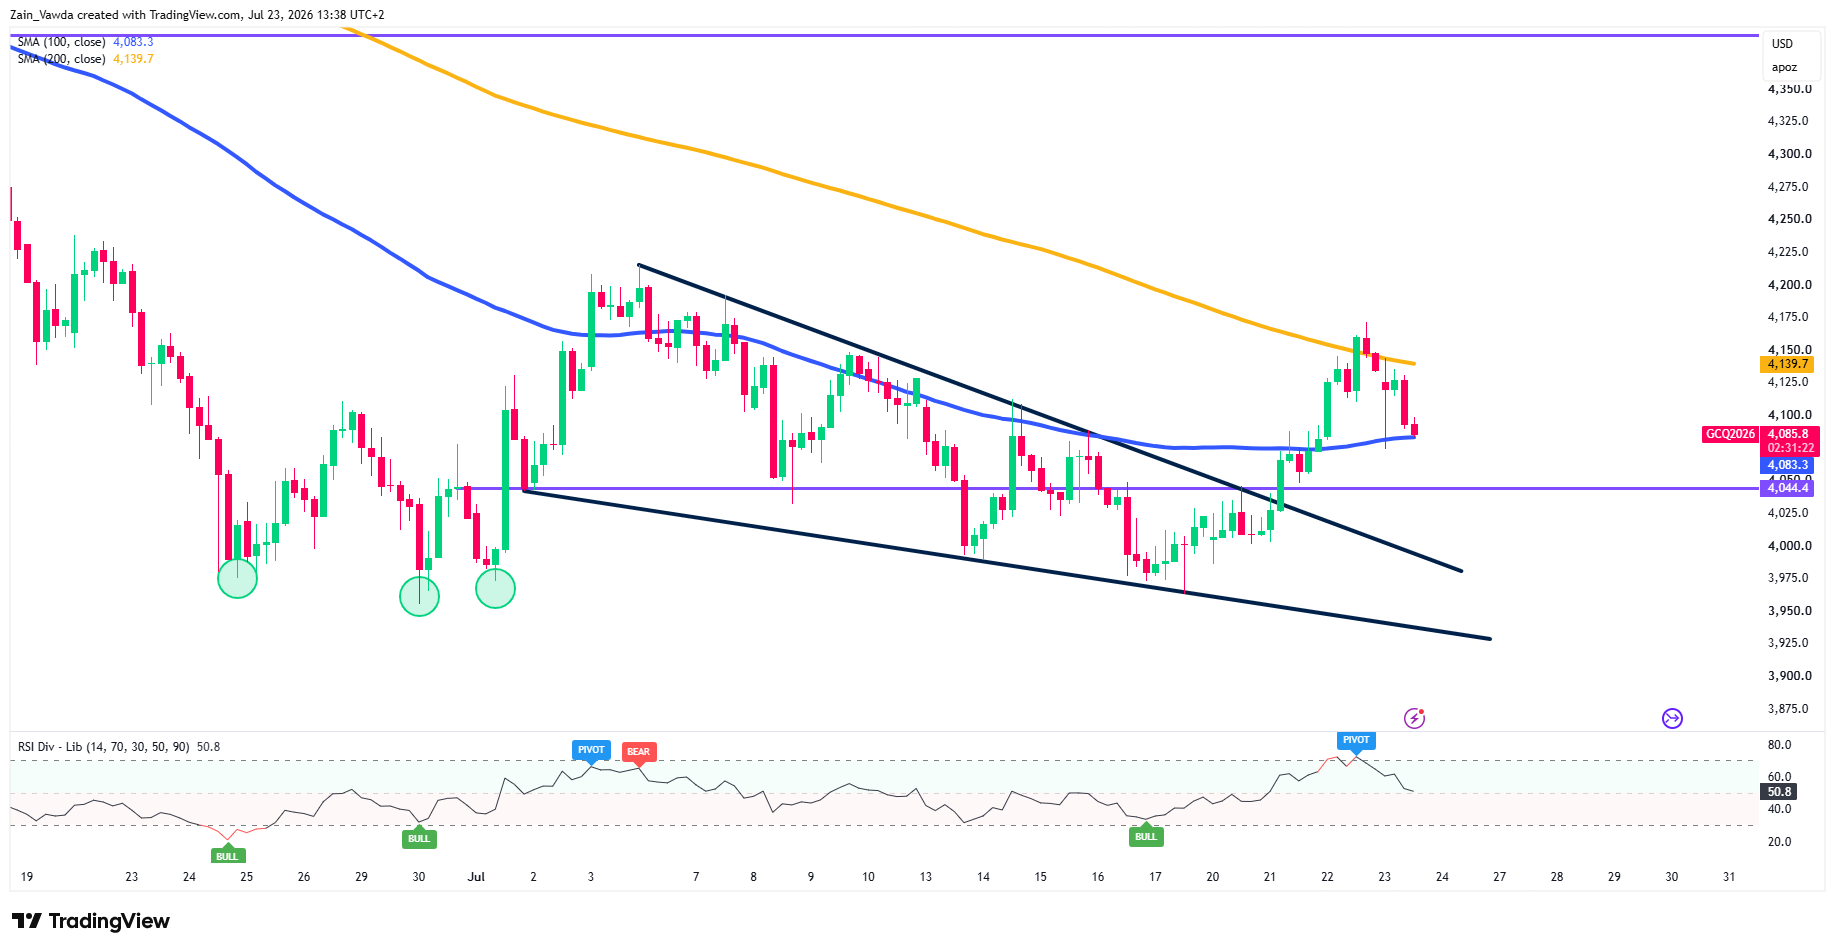
Source: TradingView
An extreme bearish divergence on MGC position data shows profitable traders are 12% more short (63% long) than unprofitable traders (75% long), signaling smart money is dialing back long exposure.
Assuming a trader wants to capitalize on this divergence, they might look for technical breakdowns to enter short positions, or use this as a structural signal to tighten stop-losses on any existing long gold positions.


