Gold walked into today's inflation print on the back foot. Hot producer prices on Thursday, crude holding above $100, and Treasury yields pressing toward 5% had lifted the odds of a Fed rate hike next week to roughly 70%, and bullion was sold down to $4,300, its weakest level in more than a week. The setup pointed lower.
Then the data landed, and gold did the opposite: it jumped, tagging roughly $4,390 within the hour.
The Print that Beat the Fear, Not the Forecast
The August CPI was not soft. But it was not the acceleration the bond market had been bracing for either and that gap is the whole story for gold.
The headline matched forecasts (0.4% on the month, 3.4% on the year), and despite August's energy spike the pass-through did not produce a bigger surprise. Core prices rose a firmer-than-expected 0.3% on the month, the hawkish detail but the annual core rate still eased to 2.4%, its lowest since early 2021.
Headline CPI YoY

Source: TradingEconomics
In plain terms: hot enough to keep a September hike on the table, not hot enough to prove inflation is reaccelerating.
That is why gold rallied. It trades as a rate story first: when the market fears higher policy rates, yields and the dollar climb, and non-yielding bullion which pays no interest becomes more expensive to hold.
An in-line headline and a cooling annual core let yields back off their near-5% highs and took a little air out of the dollar. Gold caught the relief. This was the rate channel loosening its grip, not a fresh safe-haven bid.
Market pricing based on CME data heading into the Federal Reserve Meeting have now risen to around 84% probability of a 25bps rate hike. That begs the question, can gold hold onto the post CPI gains heading into next week?
What the Charts Say: A Bounce Into a Wall
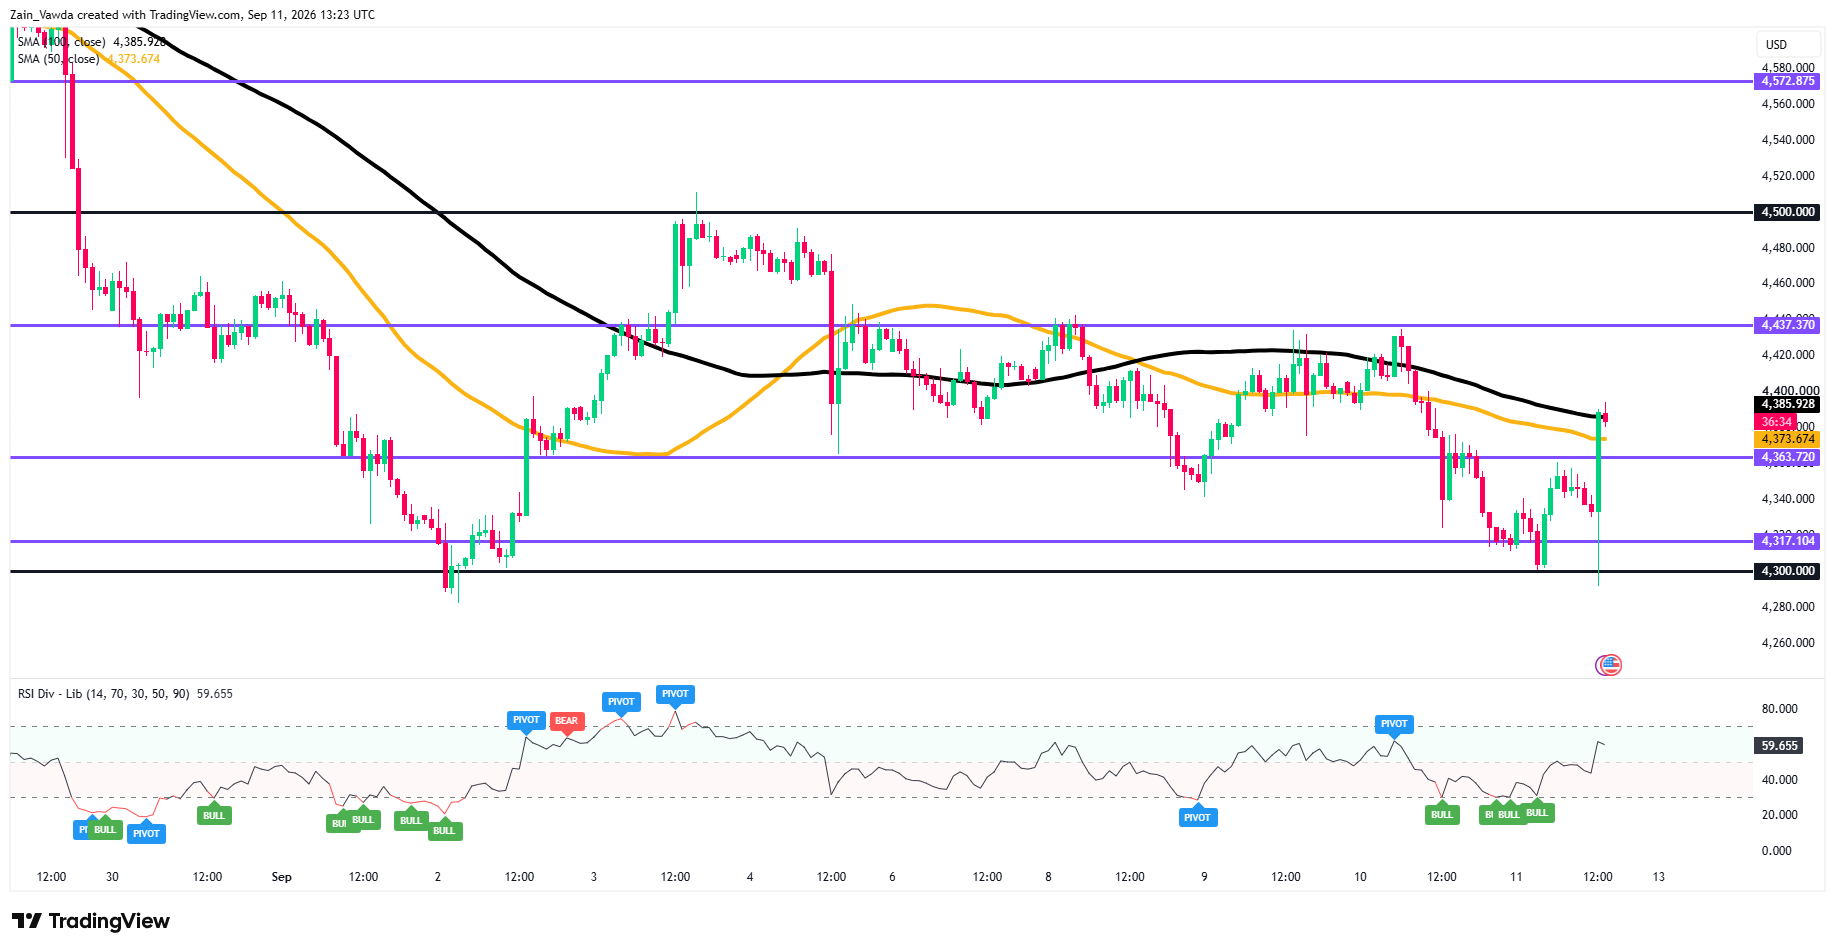
Gold (XAU/USD) One-Hour Chart, September 11, 2026
Source: TradingView
On the hourly, price rejected the $4,300/$4,317 floor and is now pressing the $4,383.72 shelf and the stacked 50- and 100-hour averages at $4,373.60–$4,386, a confluence ceiling.
RSI near 59 leaves room to run but has not confirmed a trend.
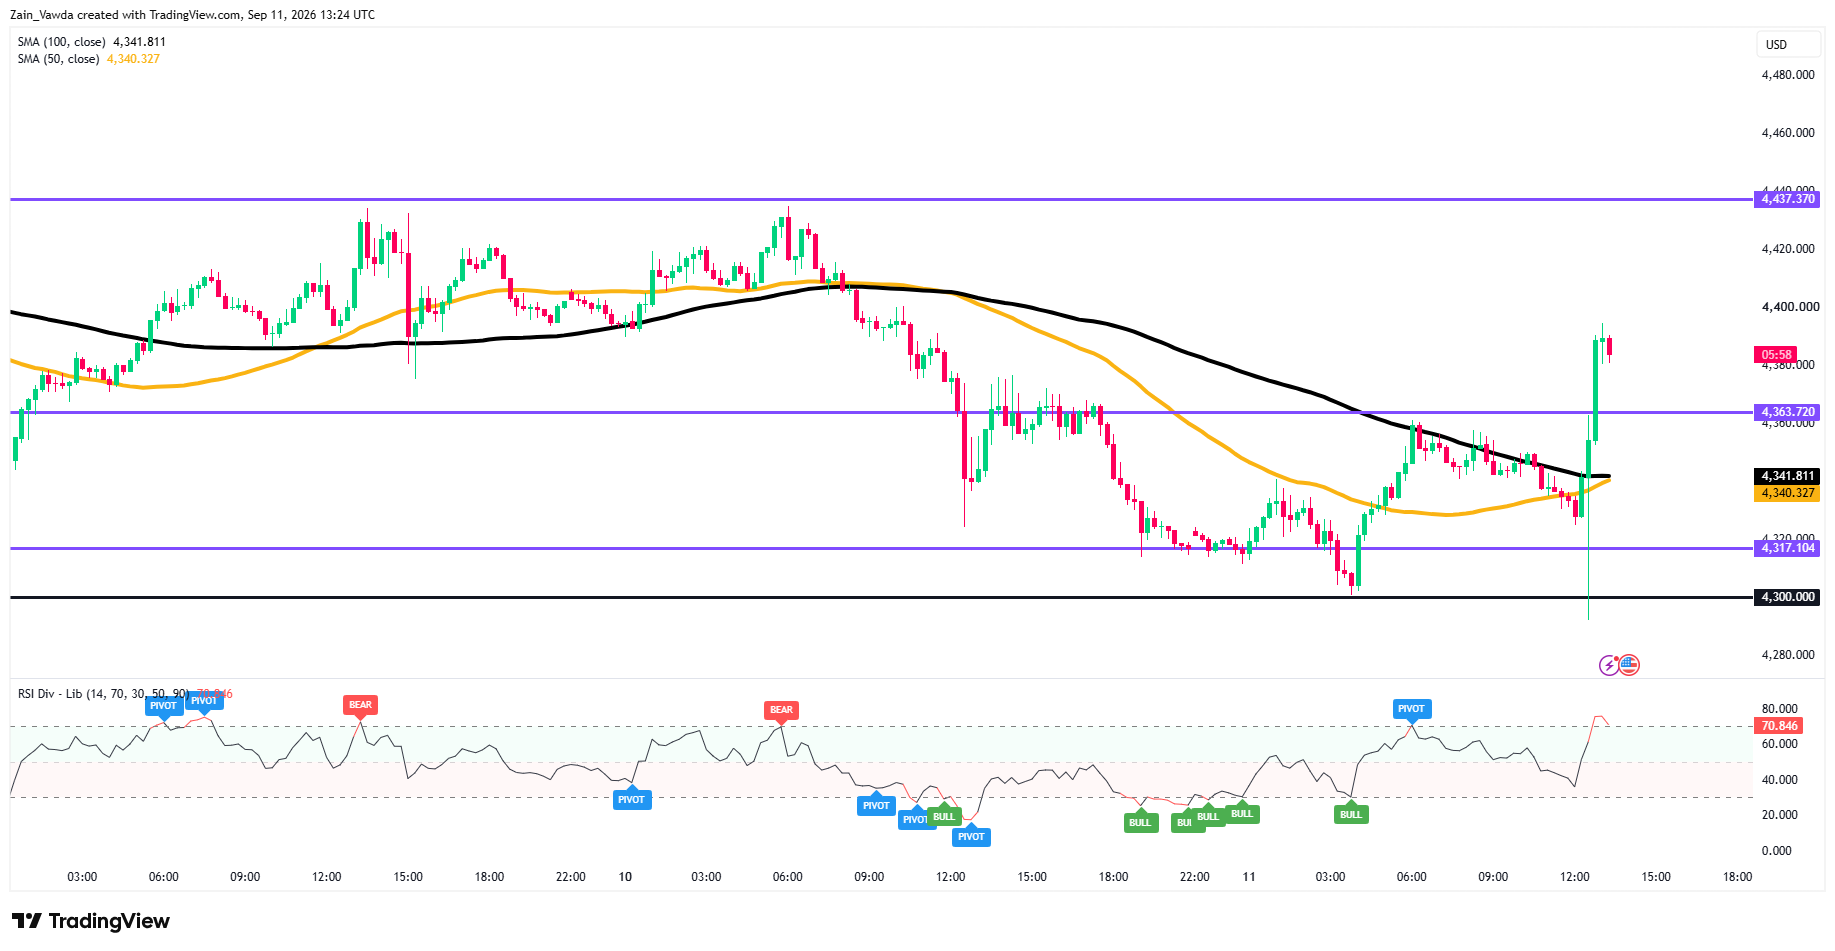
Gold (XAU/USD) M15 Chart, September 11, 2026
Source: TradingView
On the 15-minute, the spike cleared $4,363.72 and both MAs, but RSI at 72.5 is already overbought, a stretched, knee-jerk move straight into resistance.
Zoom out and the daily picture is still corrective: a head-and-shoulders sits over a $4,300 neckline, and a clean break there projects toward roughly $3,940. This is a relief pop inside the pullback from the early-2026 high near $5,300 not, yet, a confirmed low.
The Rest of Today
The next intraday tell is the University of Michigan preliminary sentiment survey and its 1- and 5-year inflation expectations, due after CPI (10:00 ET).
A hot expectations reading can re-firm yields and cap the bounce just as quickly as the CPI relieved it. Beyond that it is a Friday: weekend-gap risk into a live Fed meeting and live Iran / Strait of Hormuz headlines, where oil remains the back-door driver of the whole rate channel.
The simple intraday question is whether gold can accept above $4,386/ $4,400, or gets rejected back toward $4,336, $4,317 and $4,300.
Trader Positioning Data
Positioning Edge shows an extreme bullish divergence in Micro Gold.
The profitable cohort is 52% long and winning; the unprofitable crowd is just 26% long, mostly short and bleeding. That 26-point gap is the tell: the money-makers are riding the post-CPI bounce while the losing side fades it and pays for it.
How to use it: as confluence, not a trigger. It tilts odds to the long side and flags trapped shorts who may be forced to cover, fuel toward $4,386–$4,400. But it's a fast 4-hour snapshot into Wednesday's Fed, so pair it with your levels rather than chase on it alone.


