
Gold was supposed to have a very good Wednesday.
The United States struck more than 80 targets inside Iran overnight, President Trump declared the ceasefire “over” at the NATO summit in Ankara, Brent crude surged nearly 6% toward $78.50, and equity futures sold off hard, with Dow futures down roughly 700 points. That is the textbook setup for a safe-haven bid.
Instead, spot gold fell around 2.7% to roughly $4,050 an ounce in early U.S. trade. The haven bid failed and the reason it failed is the most important mechanism in this market right now.
The Transmission: Oil Is Now a Hawkish Input Once More
In a conventional geopolitical shock, capital rotates out of risk assets and into bullion. But 2026 is not a conventional macro regime. With the Federal Reserve under Chair Kevin Warsh having already signaled a tightening bias, nine of 18 June dot-plot submissions penciled in at least one 2026 hike, an oil spike no longer reads as a risk-off event for gold. It reads as an inflation impulse.
The chain runs: renewed Hormuz disruption lifts crude, crude lifts inflation expectations, inflation expectations lift Fed hike odds, hike odds lift real yields, and rising real yields raise the opportunity cost of holding a zero-yield asset.
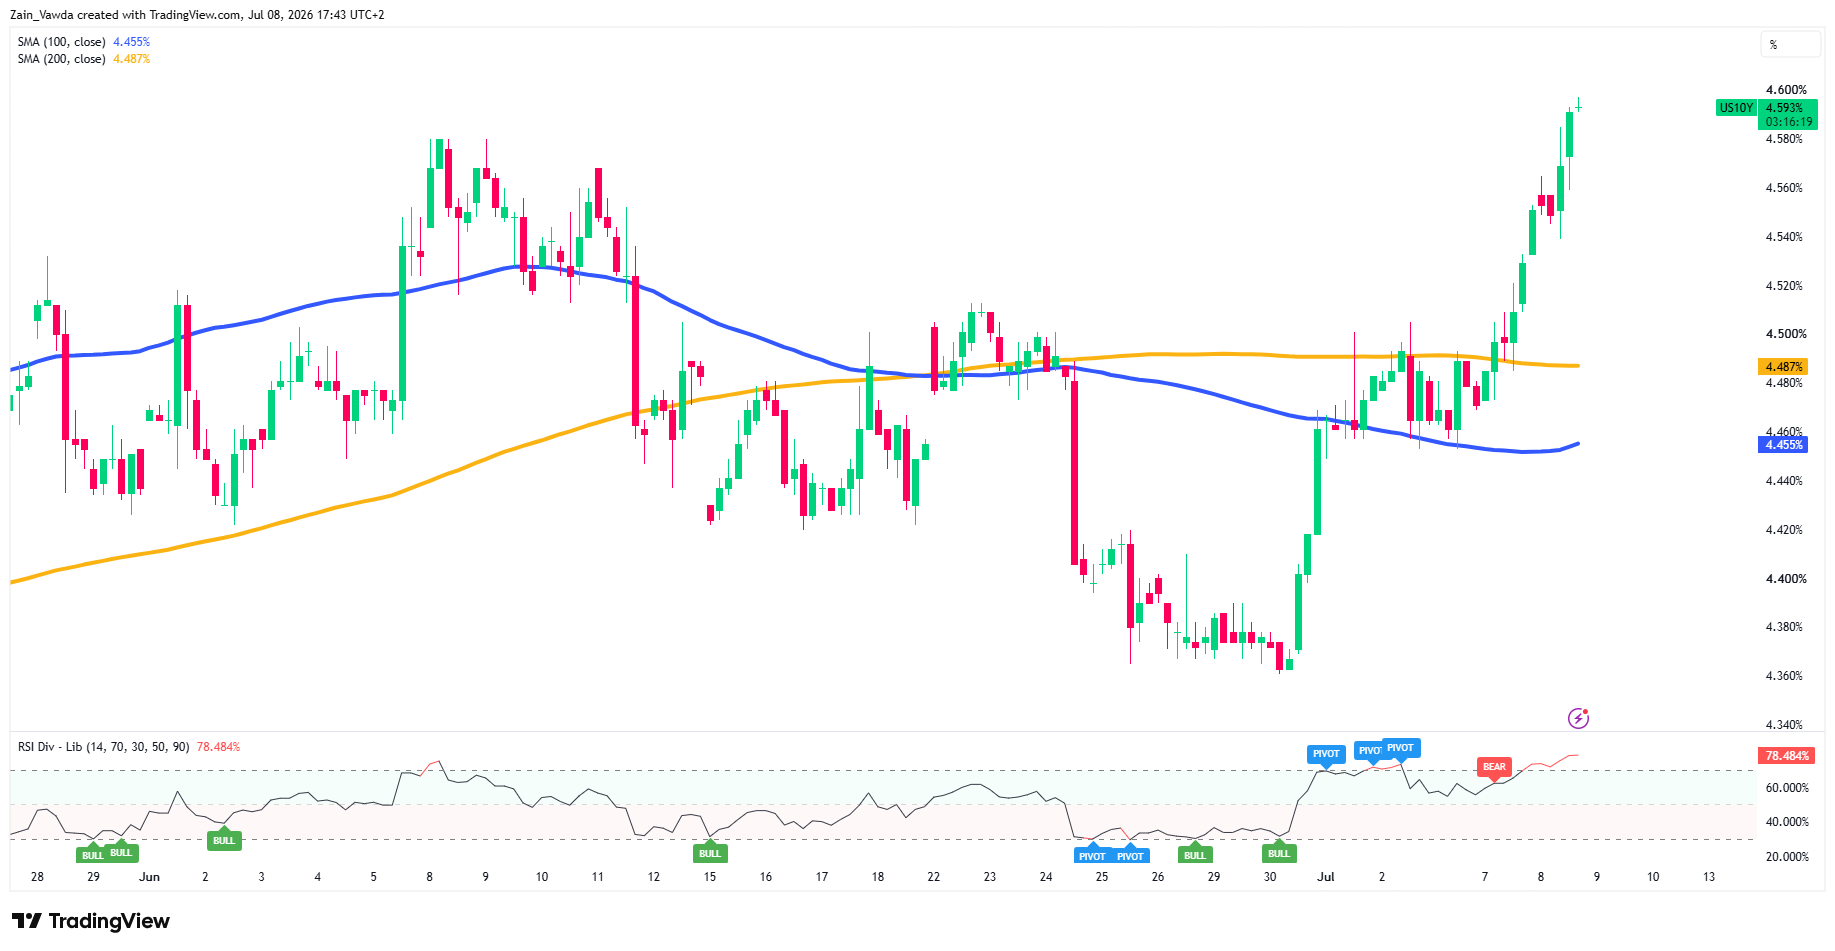
Global government bond yields jumped on Wednesday morning as markets priced exactly this.
U.S. 10Y Yield
Source: TradingView
Gold is not being sold despite the war headline; it is being sold because of what the war headline does to the rate path.
The dollar side of the equation compounds the pressure. The greenback firmed to 162.26 against the yen early Wednesday, and the tightening conviction that has kept the dollar bid is precisely what has prevented it from following past oil moves lower. A stronger dollar and higher real yields is the single most hostile combination bullion faces.
For a full dollar index update, read DXY Stalls Above 101: Will the FOMC Minutes Resolve the Fed-Jobs Market Disconnect?
What Traders Should Watch
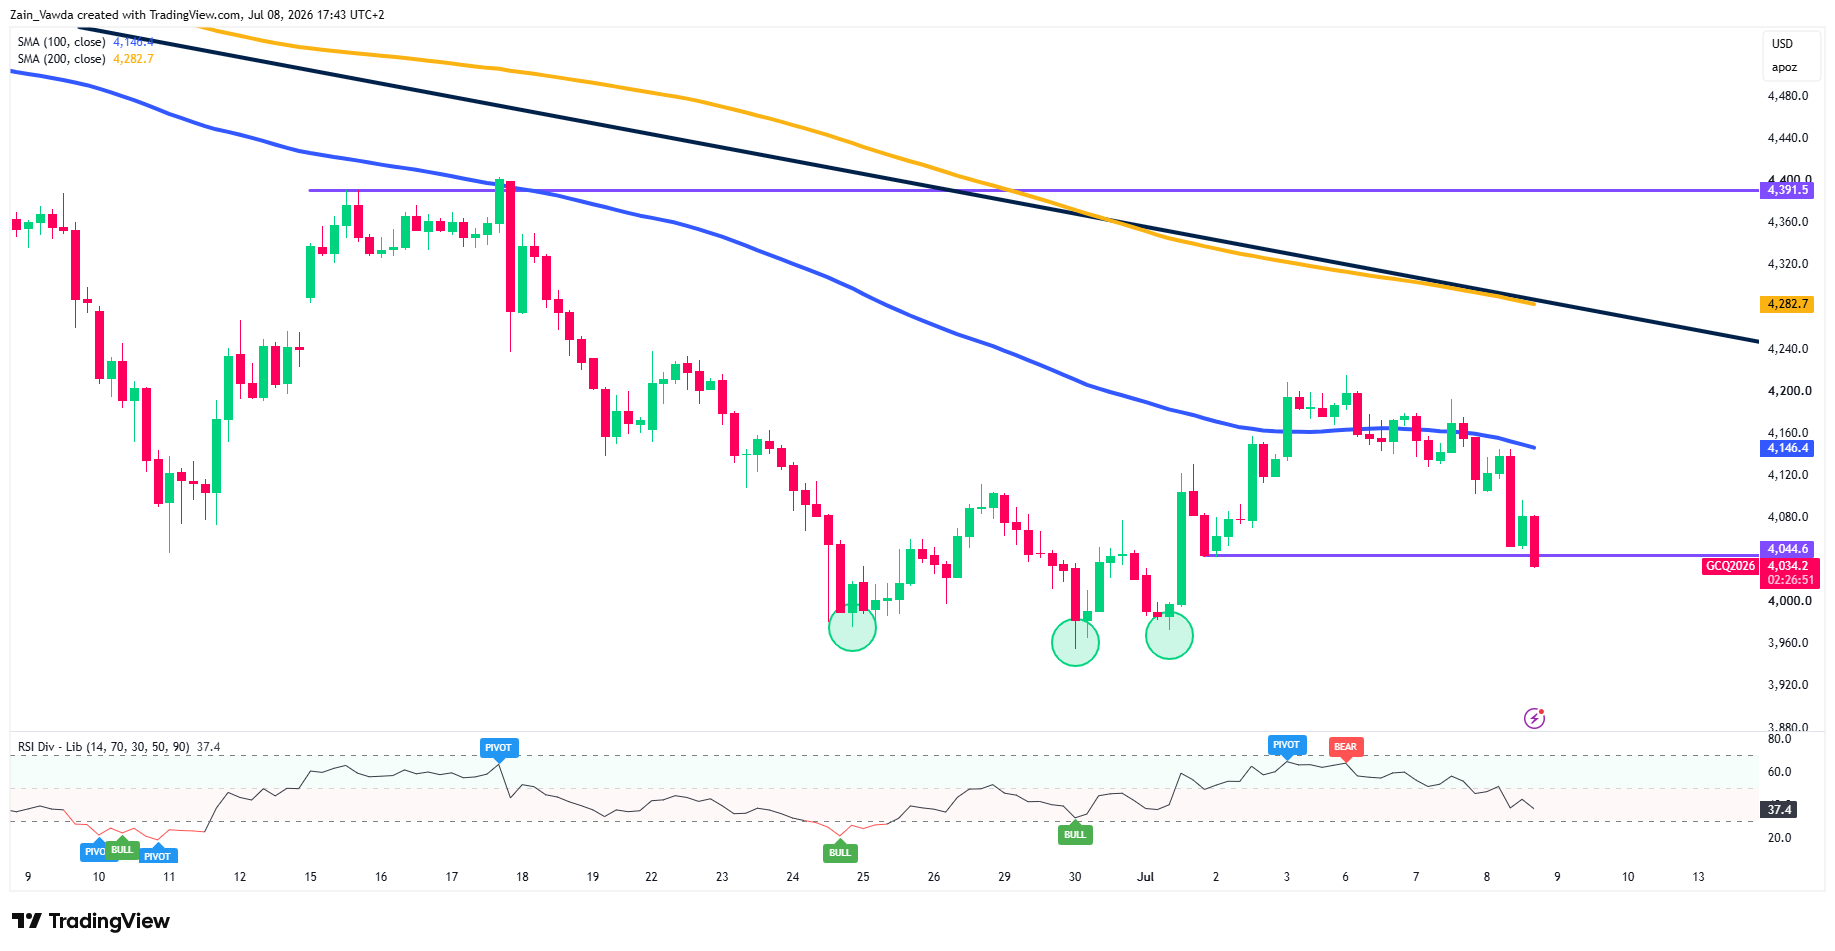
Looking at the charts, the bounce from the sub-$4,000 eight-month low printed in late June has stalled precisely where the rate story reasserted itself, and $4,000 is now the psychological floor the market will test if the Fed minutes read hawkish.
Gold Four-Hour Chart, July 8, 2026
Source: TradingView
Gold futures are currently testing a key support level at $4,044/oz with a four-hour candle close below invalidating the bullish rally which began last Wednesday.
The longer-term structure remained bearish even in the face of last week's bullish rally.
Price is capped beneath both major moving averages, the 200-day (4,283), and the descending trendline from the highs. Immediate resistance rests at $4,100 before the 100-day MA at $4,146/oz comes into focus.
RSI at 37 confirms fading momentum without signalling oversold exhaustion.
If gold fails to print a candle close below $4,044 would neutralise the breakdown. A break and candle close below opens up a retest of the triple-bottom zone around $3,990–$3,960, a level that, if broken, would expose 3,920 and mark a significant structural deterioration.
The tell for the rest of the week remains rate hike expectations except now markets will focus on the Fed minutes together with geopolitical risk and potentially rising oil prices.
Retail trader positioning data on Gold shows profitable traders are leaning long 59% versus 41% short at a 97th-percentile bullish reading over the past 30 days.
Want to see how retail traders are really positioned? Explore the Trade Validator and trade with the smart money


