
The Dow's rebound has run out of steam. After clawing back above both its key moving averages earlier in the week, a bounce that had traders eyeing 54,800.
Dow futures (YM) stalled near 53,800 and turned lower on Friday. The cash Dow fell 226 points, or 0.4%, after a much stronger-than-expected jobs report brought the Fed rate-hike trade roaring back.
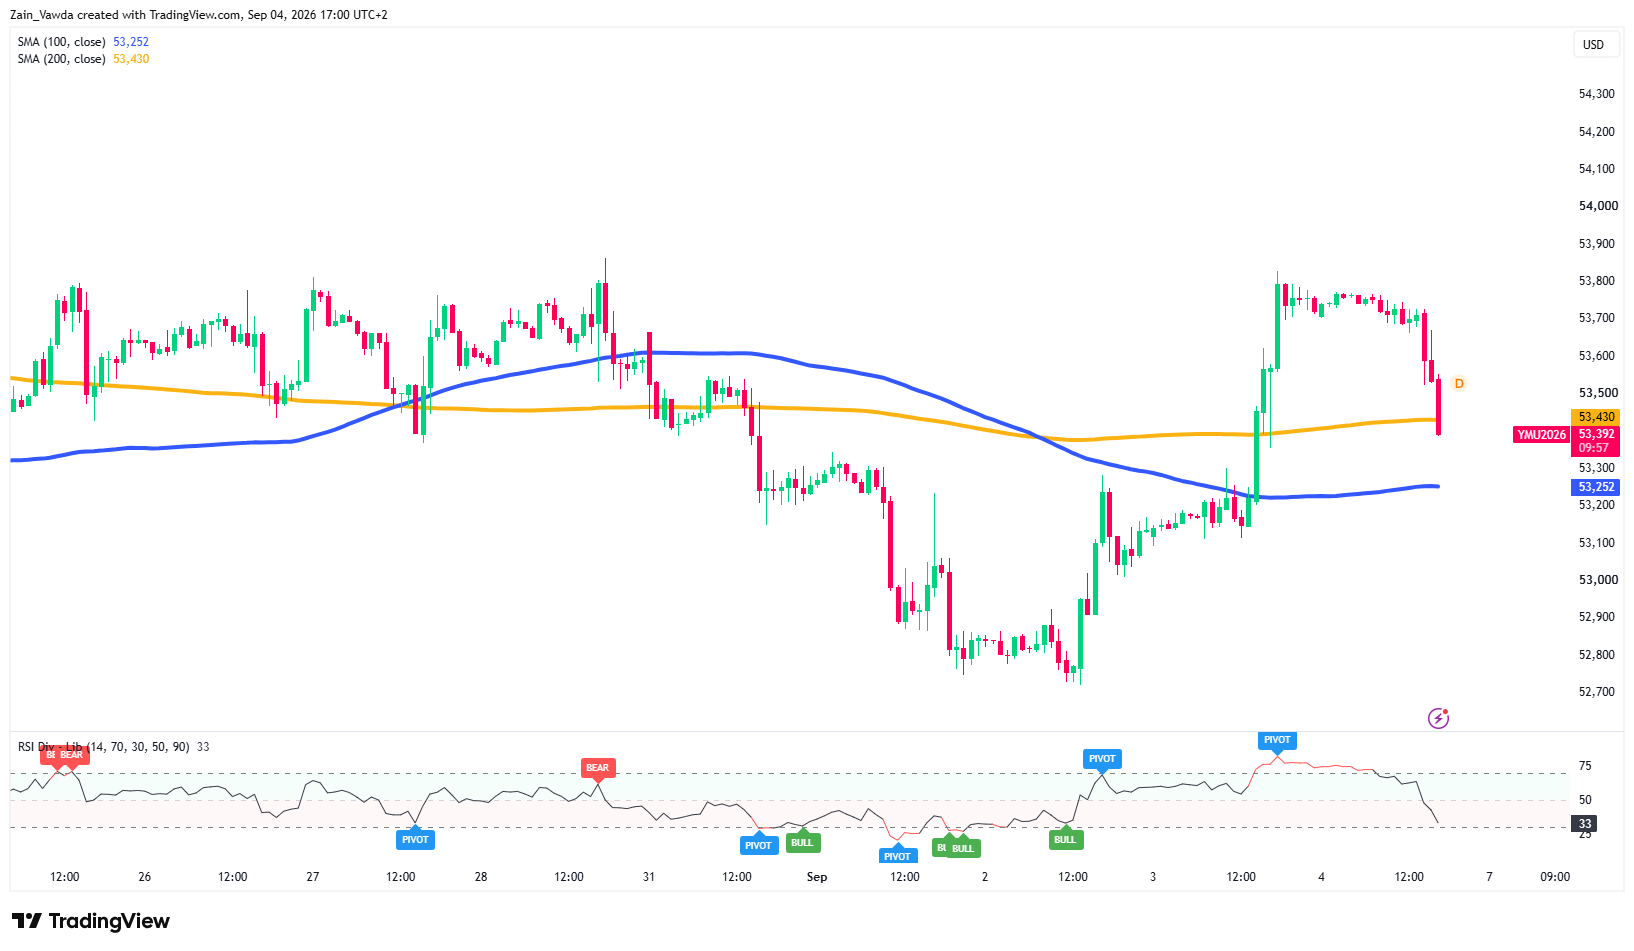
YM is now sitting between its 200-period moving average near 53,430 and the 100-period moving average at 53,250, the line that decides whether this is a healthy pause or the start of a deeper slide into the weekend.
Why the Dow Turned Lower
The trigger was the August jobs report. Payrolls grew 162,000, about three times the 53,000 economists expected and June and July were revised higher too.
A hot labour market makes a September rate hike look more likely, and higher rates are a headwind for shares. Traders now price a 60% chance of a hike this month, up from about 49% a day earlier, and the 2-year Treasury yield jumped. Rising yields pull money toward bonds and away from stocks, and the rate-sensitive Dow felt it most.
A day earlier the mood was the opposite. Fed Governor Christopher Waller said he was "inclined to support" holding rates steady this month, yields eased, and the Dow rallied.
That whipsaw, dovish Waller on Thursday, hot jobs on Friday is why the index is now stuck in a tug-of-war.
Federal Reserve Chair Kevin Warsh's hawkish Jackson Hole message still hangs over the market, while President Trump has piled on, publicly demanding lower rates.
The Technical Picture: H1 and M15
Dow Jones One-Hour Chart, September 4, 2026
Source: TradingView
On the one-hour (H1) chart, YM has recorded a close below its 200-period moving average near 53,430, while still holding above the 100-period average near 53,250. Momentum has cooled but is not extreme, the hourly RSI sits around 33, with room to fall.
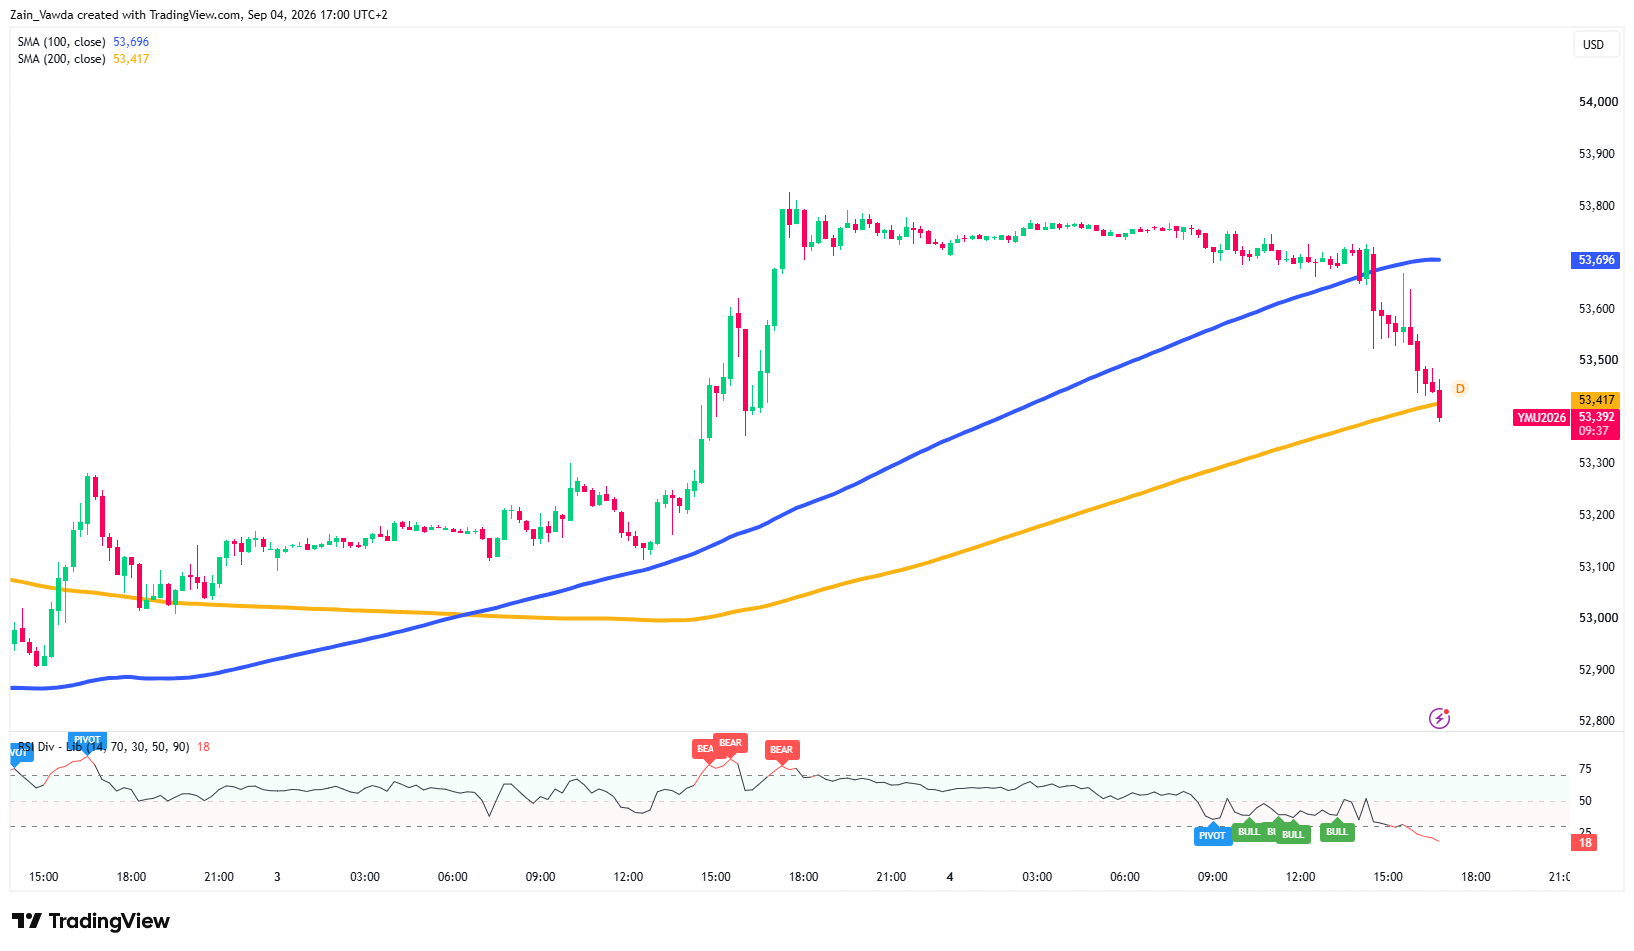
Dow Jones M15 Chart, September 4, 2026
Source: TradingView
Zoom into the 15-minute (M15) chart and the drop looks stretched in the very short term: price has flushed below both its moving averages and the RSI has collapsed to about 18, deep in "oversold" territory. A reading that low often sparks a bounce but a bounce is not the same as a bottom.
The 53,429–53,250 zone, where the M15 and H1 100-period averages sit almost on top of each other, is the immediate line in the sand. A move back above the 53,429 level and bulls will regain a foothold; stay below it and sellers keep control and eye a break of the 100-period MA.
Three Ways It Breaks Into the Weekend
| Scenario | What It Triggers | Levels In Play |
|---|---|---|
| Bearish | Yields keep climbing; hot-CPI fears and Warsh's hawkish bias win out. YM loses the 100-period cluster. | Below 53,392 opens 53,252 → 53,000 → 52,700. |
| Base | Oversold M15 sparks a bounce that stalls under resistance. Traders wait for CPI before committing. | Chop between 53,250 support and 53,800 resistance. |
| Bullish | Yields ease on dovish Fed-speak, Trump pressure or softer weekend headlines; the oversold bounce holds. | Reclaim 53,430 → 53,600–53,800, re-opening 54,000 and beyond. |
For The Trader
YM futures reopen Sunday evening and the headline risk is high. More Fed speakers, Trump's trade threats, Middle East oil, and CPI on the horizon. Keep size sensible into the close, because gaps can jump straight through tight stops.


