
US stocks jumped when the market opened on Thursday and held the gains, with all three major indexes higher as traders grew more hopeful the Federal Reserve will leave interest rates alone at its September meeting.
Since the open, the Dow has led on points, up around 635, or 1.2% and was pacing for its best day since August . The S&P 500 added about 1%, while the Nasdaq 100 tracked the broader Nasdaq Composite’s roughly 1.3% climb as falling yields lifted tech.
What Drove the Move
The spark was Fed Governor Christopher Waller, who said he would be inclined to back holding rates steady this month unless upcoming inflation data surprises.
That matters because markets had been pricing a real chance of a September hike not a cut, under new Chair Kevin Warsh, so a well-known official leaning toward “hold” took some pressure off. After his remarks, the odds of a September hike fell to 50.4% from 63.2% a day earlier, per the CME FedWatch tool.
Bond yields eased in response, with the 10-year Treasury yield slipping to around 4.75%, a day after touching its highest level since November 2023. A sharp rally in the Japanese yen, up about 2% at 155.47 added to the downward pull on yields, as money that had chased higher US rates started heading back to Japan.
Lower yields tend to help stocks, especially rate-sensitive tech, and that offset another day of rising oil (WTI near $92, Brent above $96, both up about 1%).
The Single Stocks Moving the Tape
Snowflake jumped more than 19% after strong earnings and guidance. Tesla rose about 7% ahead of its Cybercab robotaxi reveal after the close. Robinhood added around 11% on optimism about prediction markets.
On the downside, Broadcom fell about 4% after a soft revenue forecast.
Dow Jones Technical Outlook (4-hour chart)
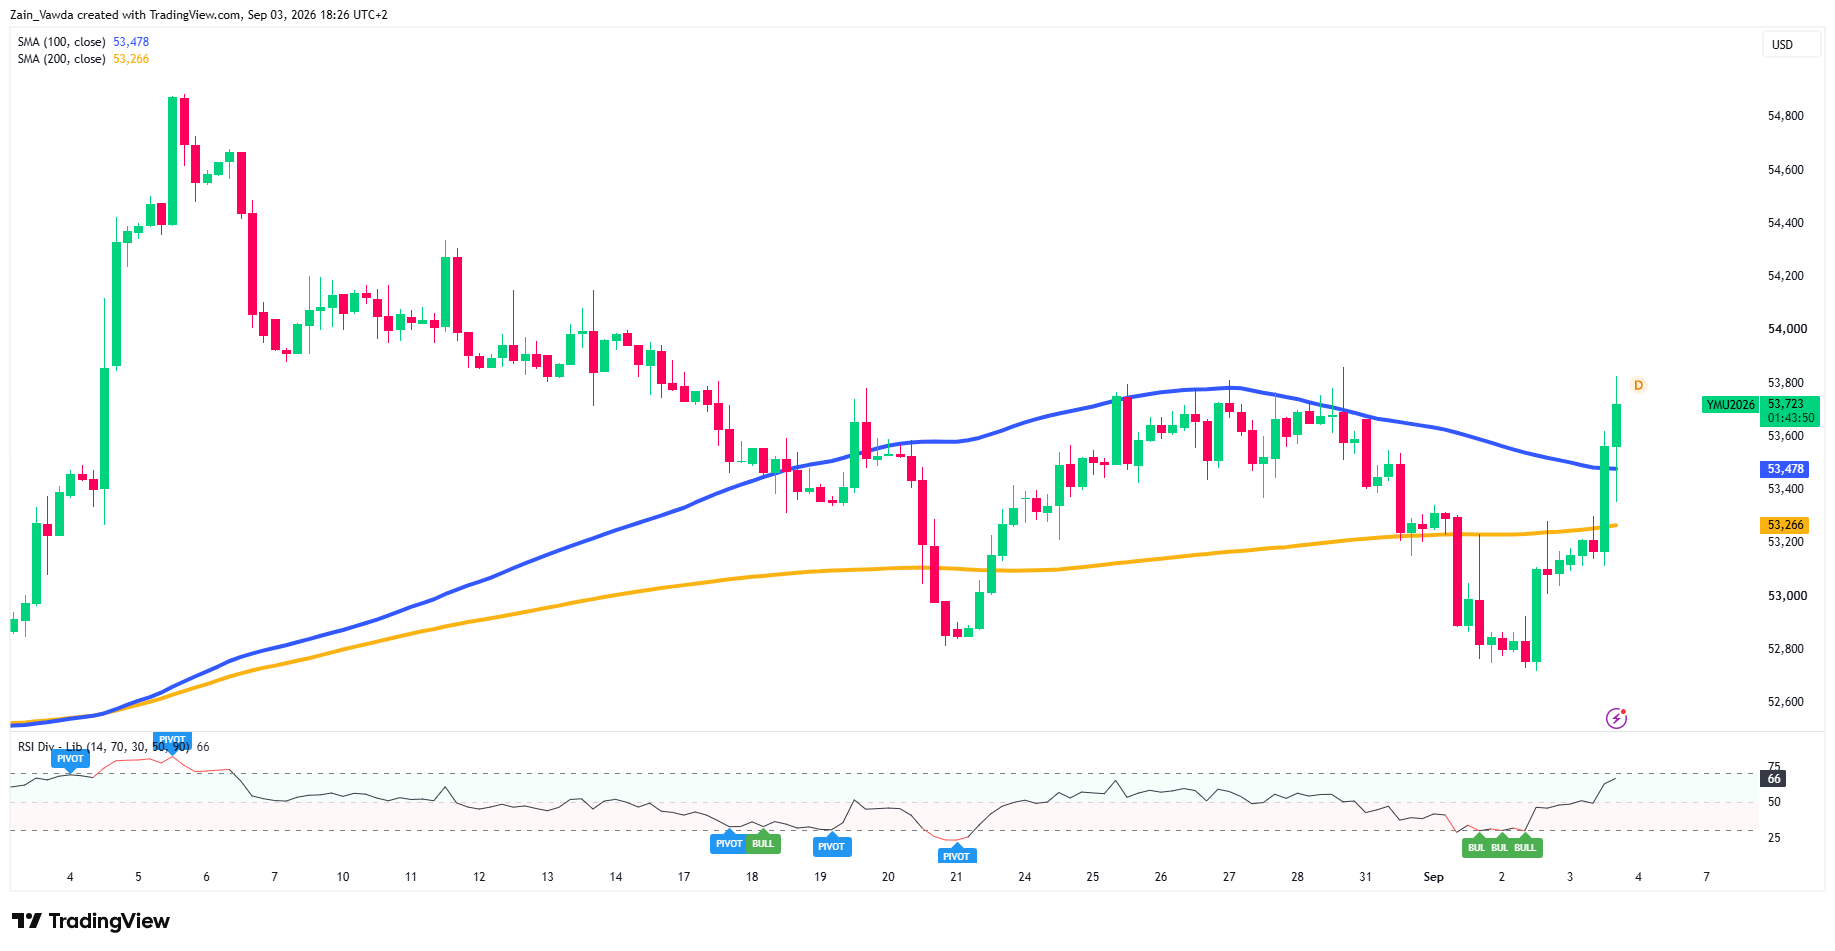
On the 4-hour timeframe, YM staged a sharp bullish reversal today, powering back above both its 100-period moving average (53,478) and 200-period moving average (53,266) in a single strong green candle to trade near 53,723.
Dow Jones (YM) Four-Hour Chart, September 3, 2026
Source: TradingView
That is a real shift: for the previous two sessions price had been pinned below both averages, sliding to a low near 52,700 on September 1–2, where the chart’s bullish signals fired.
Momentum backs the move. The RSI has climbed to about 66 from oversold territory, pointing up but now nearing the 70 line that often marks a short-term stretch.
In plain terms: the bounce is strong, but it is getting close to the zone where it can pause or stall.
The key question now is whether those moving averages flip from ceiling to floor. Holding above the 100-MA (53,478) keeps the bulls in control, with the 200-MA (53,266) as the backstop just below.
Lose both and the recent 52,700 low comes back into view. On the upside, first point of concern for bulls is around the 53,800-54,000 area before the early-August swing high around 54,800 comes into view.
Three Ways It Plays Out — Keyed to Friday’s Jobs Report
| Scenario | Trigger | Dow Jones Impact |
|---|---|---|
| Extends Higher | Soft jobs report cements the “hold” case; yields fall further | YM clears 53,800 and targets 54,000, then the 54,200 shelf. |
| Holds the range (base case) | Mixed jobs data; Fed odds stay split down the middle | YM chops between the 100-SMA (53,478) and 53,800, digesting the bounce. |
| Rolls back over | Strong jobs report revives September hike bets; yields jump | YM loses both moving averages, putting the 52,700 low back in play. |
For Traders
Buying the first strong candle of a reversal, after it has already run roughly 1,000 points off the low, is where the traders tend to get caught chasing.
Disciplined traders wait for a pullback that holds the reclaimed averages (53,478 / 53,266) as support, or for a clean break of 53,800, rather than paying up at the top of a vertical move into Friday’s jobs report.


