
Bitcoin (BTC/USD) Futures staged a modest recovery on Thursday, hovering just above the $77,500 handle after finding solid dynamic support near $76,000.
The underlying market structure reveals a fascinating and highly precarious tug-of-war. While speculative traders position themselves for an impending volatility breakout, a combination of stalling institutional demand, significant options expiry hurdles, and stubborn on-chain resistance suggests that the road higher remains fraught with structural roadblocks.
ETF Outflows: The Institutional Engine Sputters
The core narrative backing Bitcoin's major moves over the past year has undeniably been the influx of institutional capital via US Spot ETFs. Right now, that engine is showing distinct signs of fatigue.
Bitcoin exchange-traded funds extended their losing streak to a fourth consecutive session of net withdrawals. Leading the charge on the sell-side is BlackRock, pacing a broader $70 million loss across the ETF landscape.
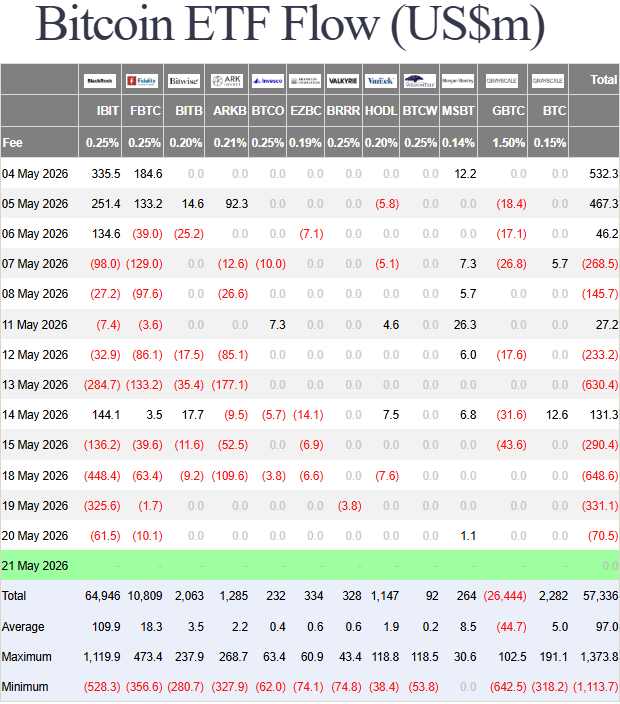
Source: Farside Investors
This persistent outflow streak serves as a stark reminder of institutional appetite in the current uncertain environment. Without a steady stream of spot demand from these fund vehicles to continuously absorb overhead supply, the market becomes heavily reliant on derivative-driven momentum, which is historically prone to sharp, sudden liquidations.
On-Chain Metrics: The Clashing Threshold of Bull vs. Bear
Going by the on-chain data provided by Glassnode, the internal mechanics of the market call for near-term caution.
Bitcoin's recent foray up toward the $82,000 region felt constructive to many market participants, but crucially, it failed to solidify a structural regime shift. The price has slipped back below the True Market Mean at $78,300.
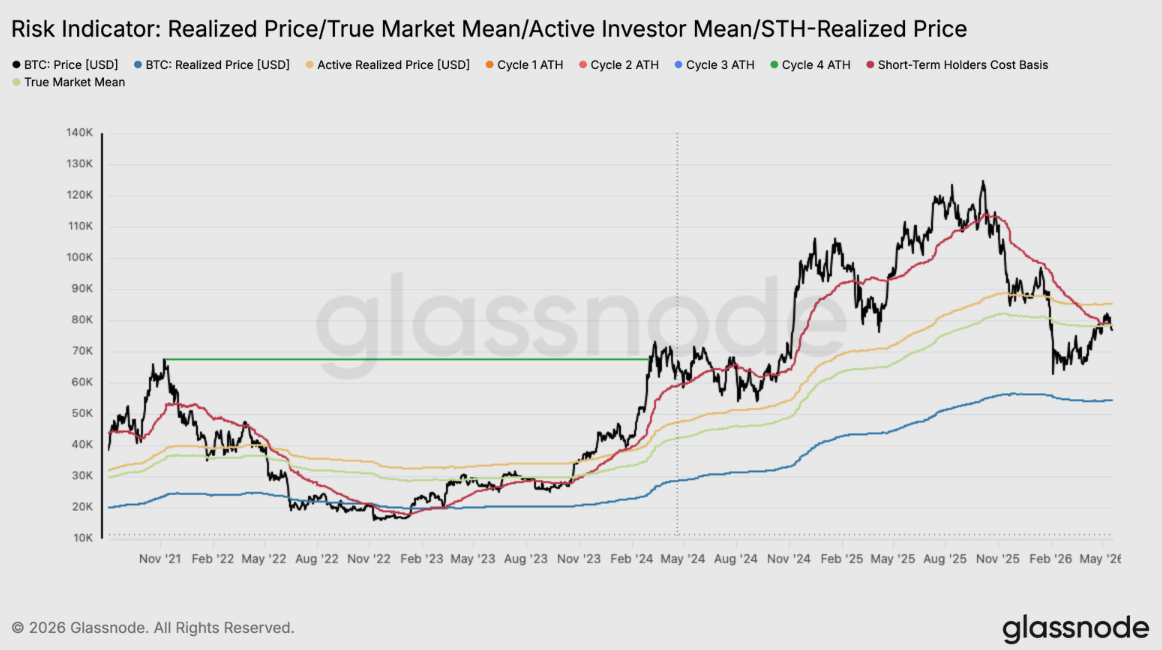
Source: Glassnode
Historically, this metric tracks the average acquisition cost of actively transacted Bitcoin supply and serves as the ultimate dividing line between bull and bear market structures. Reclaiming it on a single breakout is one thing; sustaining a consolidation above it over several weeks is what confirms a true bull market continuation.
The data shows that profit-taking has aggressively outpaced organic demand. The 30-day Simple Moving Average (SMA) of the Realized Profit/Loss Ratio spiked from its February low of 0.4 to a reading of 1.8.
While a bounce in profit-taking is entirely logical following a price recovery, the reality is that the broader market has not generated enough buy-side conviction to cleanly digest this wave of distribution. Until this ratio comfortably establishes itself above 2.0 for a sustained period, rallies run a high risk of being treated as exit opportunities by earlier buyers.
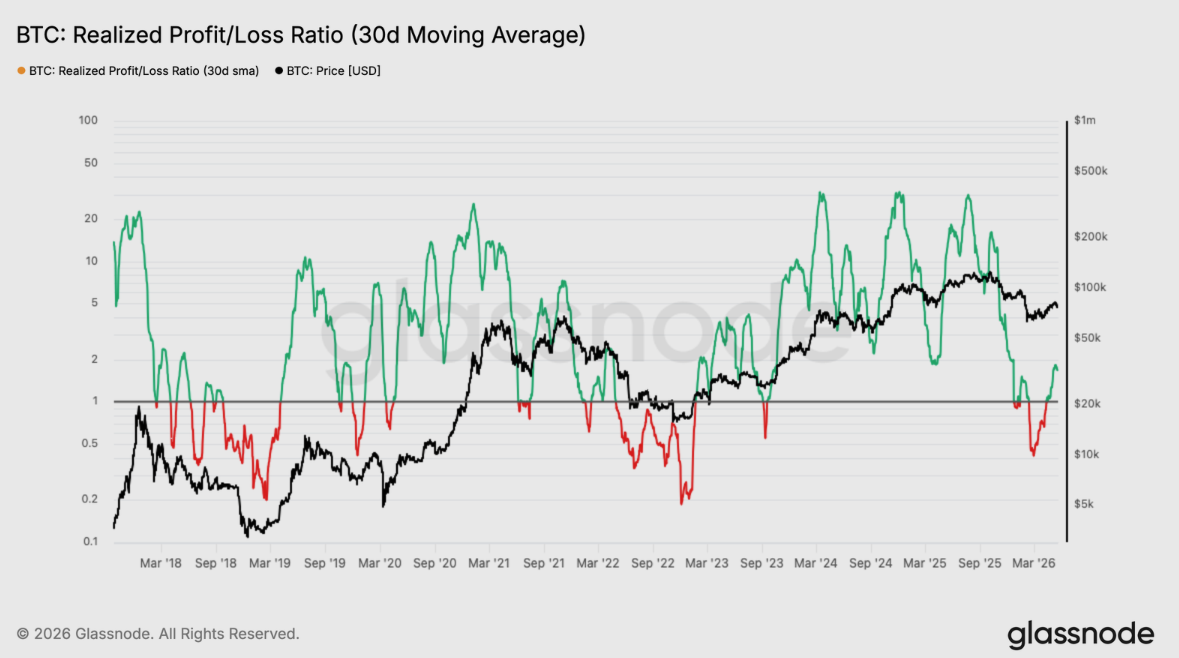
Source: Glassnode
Furthermore, looking at the Realized Price by Age, the cost basis of the newest cohort of accumulators (those within the last 30 days) sits exactly around $78,200. Because spot prices are trading beneath this level, these short-term buyers are now holding unrealized losses.
This turns a previous support floor into an overhead supply zone, as breaking even will likely trigger incremental selling pressure.
Derivatives View: Caught Between a Max Pain Floor and a Call Wall
The immediate price action is also tightly bound by the structural layout of the options market. Hype-driven retail positioning has triggered a significant uptick in trading volumes, but option market makers are holding a very clear perimeter.
Bitcoin currently finds itself trapped ahead of a massive $6.25 billion options expiry. The technical and psychological boundaries are beautifully defined:
The Downside Floor: The options "Max Pain" strike price sits squarely at $75,000. This acts as a powerful gravitational pull, as option sellers face an economic incentive to see the underlying asset pin closer to this level at expiry to render the maximum number of options contracts worthless.
The Overhead Ceiling: On the upside, a massive "Call Wall" is established at $80,000. The heavy open interest concentrated at this strike represents formidable resistance, as market makers dynamically hedge their short call positions by selling spot into the rally as price approaches the wall.
Technical Analysis - Bitcoin Futures
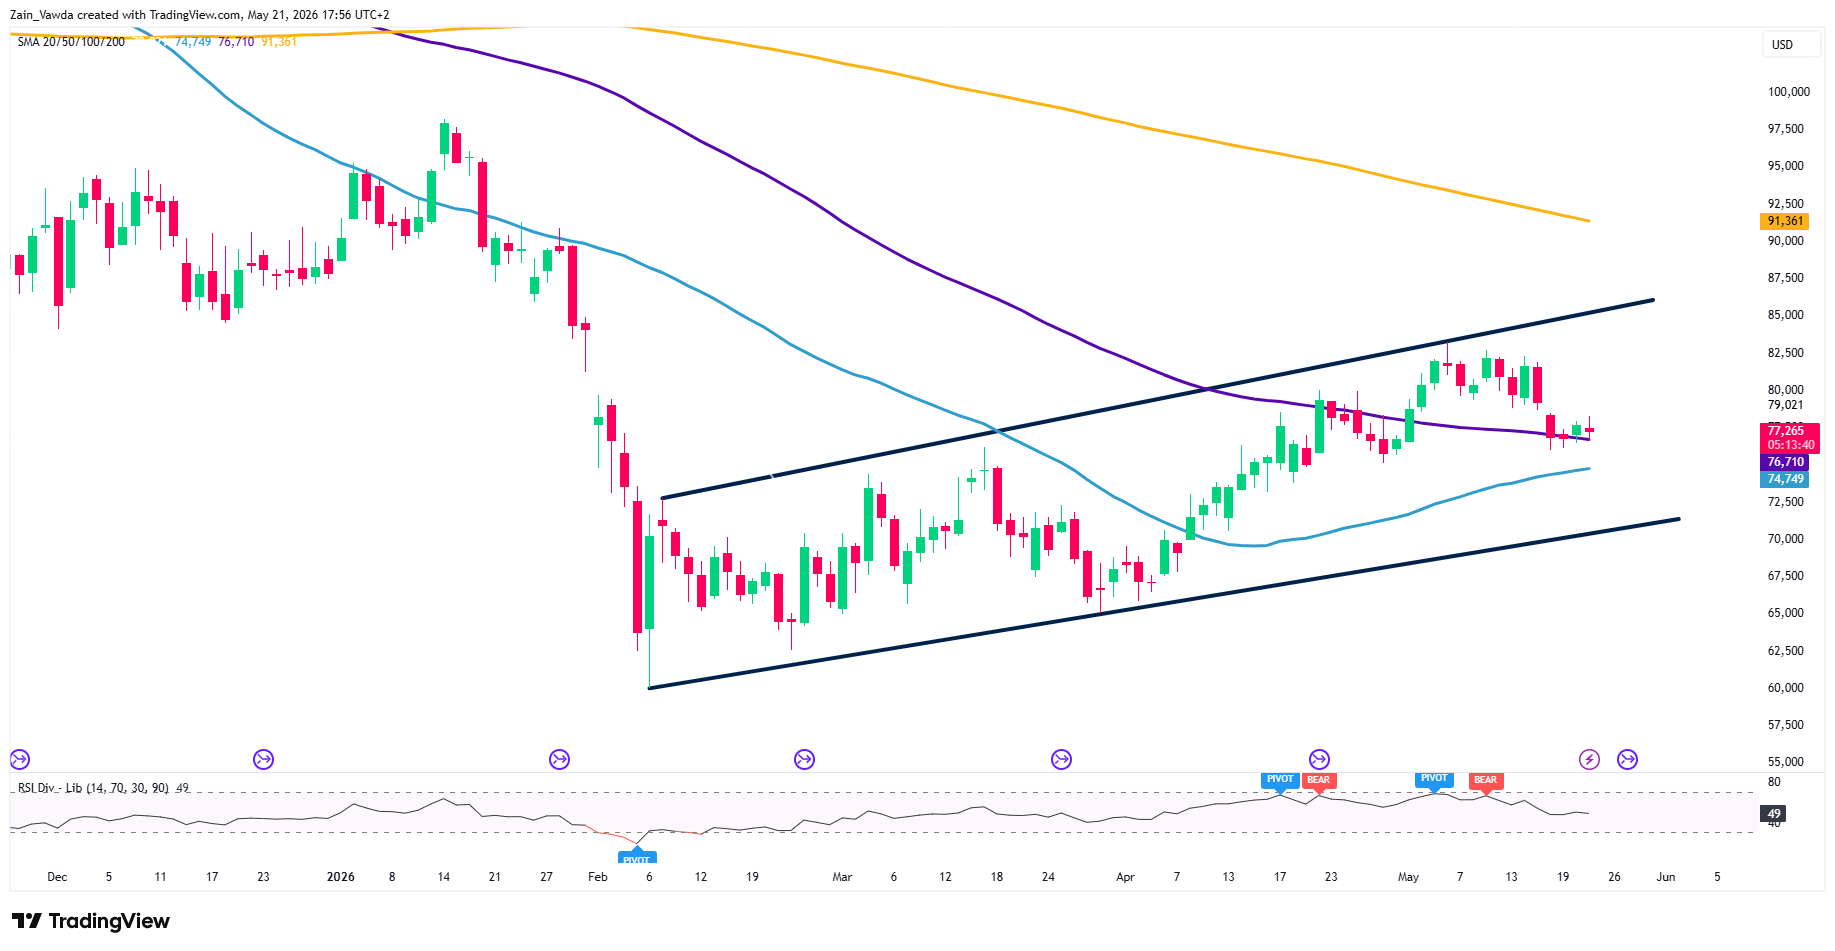
From a purely technical perspective, Bitcoin's short-term price action remains beautifully rangebound but wound up like a spring, signaling that a major volatility breakout is brewing.
Bitcoin Futures (BTC1!) Daily Chart, May 21, 2026
Source: TradingView
For now Bitcoin continues to trade within a well-defined ascending channel, recovering sharply from early February lows near $60,000.
The price action highlights a constructive series of higher highs and higher lows, though recent momentum has stalled near the upper boundary of the channel around the $82,500 mark.
Price currently rests on the 100-day MA while the 50-day MA rests just below at $74,749 providing support.
Sellers are actively defending the psychological $\$80,000$ zone. A clean daily breakout above the channel’s upper trendline is required to shift the bias aggressively bullish toward the 200-day MA (yellow) at $91,361.
The Verdict
While the geopolitical headlines out of the US and Iran offer little to support a risk-on narrative, the hard market data also suggest caution.
Until ETF outflows flip positive or on-chain demand structurally reclaims the True Market Mean at $78.3k, expect choppy, derivative-fueled price action to dominate the landscape as the clock ticks down to expiry.


