
Bitcoin looks to be facing a defining structural shift as May 2026 draws to a close. After months of highly coordinated liquidity absorption, a cocktail of institutional exhaustion, whale deceleration, and high-profile narrative shifts has plunged Bitcoin (BTC) into its longest consecutive correction cycle of the year.
If you want to know where prices are heading over the next month, you need to understand the current market dynamics surrounding Bitcoin.
The Macro Liquidity Drain: ETF Bleed and the Corporate Signal
At the center of the current downward pressure is a sharp reversal in the institutional product pipeline. Spot US Bitcoin ETFs have hit their ninth consecutive day of negative flows, registering a combined loss of roughly $2.8 billion. This historic outflow streak represents the longest sustained bleed since the asset class was institutionalized.
As the spot vehicles unwind, the automated market makers and authorized participants behind them are forced to liquidate spot inventory, creating an ongoing drag on order book depth.
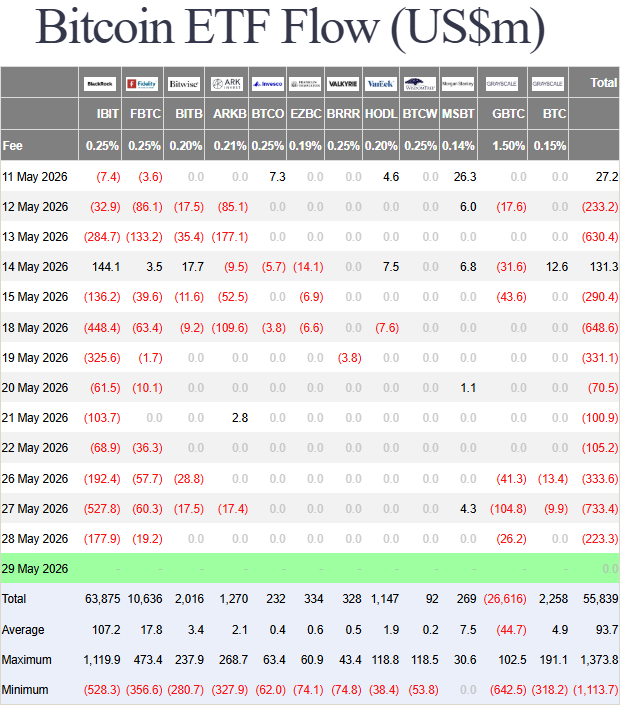
Source: Farside Investors
Compounding this structural selling is a psychological tremor from the corporate treasury ecosystem. MicroStrategy (MSTR), historically considered the market’s ultimate "never sell" HODLer, shocked markets by breaking its long-standing promise and liquidating a portion of its Bitcoin holdings.
While the operational reality of the sale may have been dictated by tactical corporate restructuring or tax balancing, the symbolic impact was swift. It dismantled a cornerstone narrative of absolute corporate accumulation, introducing a variable that risk desks are now pricing as structural sell-side overhead.
The On-Chain Reality: Whale Deceleration and Glassnode Indicators
Turning to the underlying blockchain architecture, Glassnode’s global metrics provide an unvarnished view of this momentum shift.
On-chain transparency reveals that Bitcoin whale accumulation has slowed down significantly over the past two weeks. The rate of large-entity wallet creation and balance growth has flatlined, indicating that the market's largest Capital Allocators are sitting on their hands or actively distributing into shrinking liquidity pools.
Key insights from the data reveal several core trends:
- Top-Heavy Buyer Concentration: A significant volume of recent buyers acquired Bitcoin in the $75,000 to $78,000 range. This creates a "top-heavy" market structure. If Bitcoin cannot stay above $78,300 (the active market average cost), these new buyers may panic and sell, risking a sharper price drop.
- Moderate Capital Flow: While capital flowing into Bitcoin remains positive, the momentum is low. Glassnode’s Realized Profit/Loss Ratio sits at 1.56, which is well below the levels typically seen during explosive, sustainable bull markets.
- Fading Institutional and Spot Demand: The initial boost that pushed prices up has cooled. Spot market buying has turned into net-selling, and US Spot ETF flows have flipped sharply negative after weeks of strong inflows.
- Crushed Volatility: Expectations for massive, immediate price swings are plummeting. Options market data shows that implied volatility across all contract dates has compressed to multi-year lows.
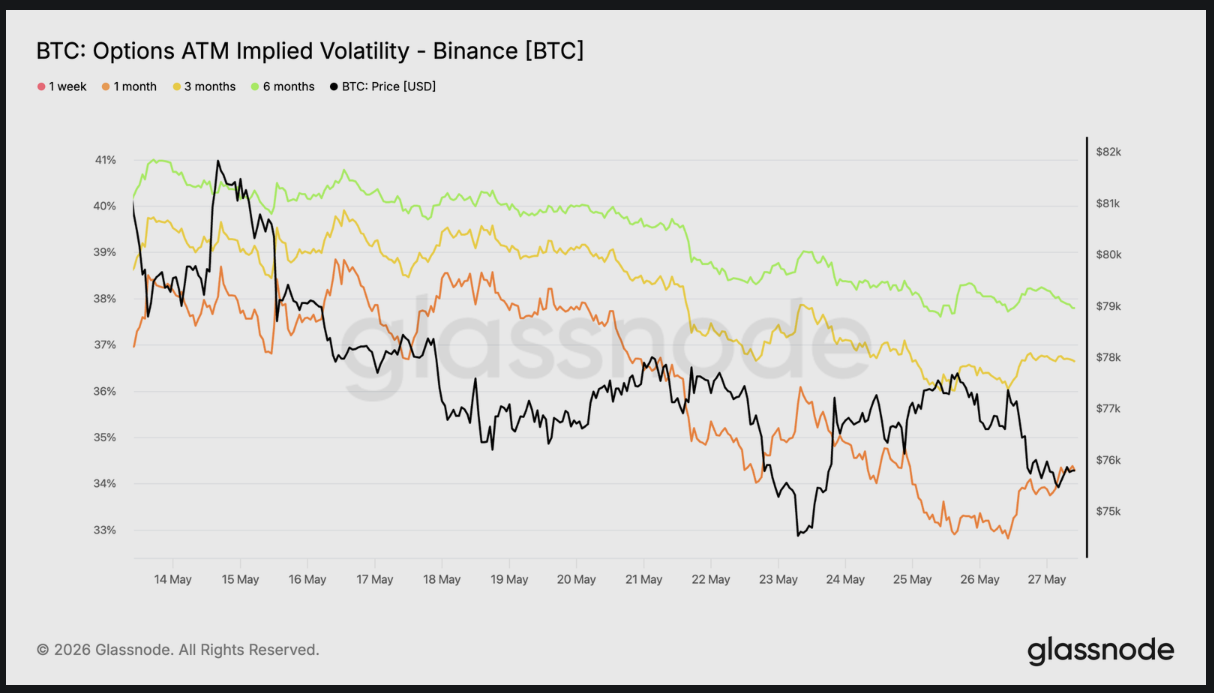
Source: Glassnode
Bitcoin remains structurally stable, but the engine is running out of steam. Without a renewed influx of aggressive spot demand or a return of positive ETF inflows, the market is highly vulnerable to further consolidation or a short-term breakdown below $75,000.
What Lies Ahead: Projecting the June Price Action
As the market enters June, the confluence of these metrics suggests that Bitcoin is caught in a classic structural reset rather than a terminal bear cycle.
According to recent predictive technical frameworks and historical volume profiles, June is shaping up to be a month defined by wide-ranging volatility and potential capitulation wicks.
The slowing of whale accumulation and the MSTR narrative break have successfully cooled an overheated derivatives market, flushing out over-leveraged long positions. Moving forward, the primary metric to track will be the stabilization of spot ETF flows.
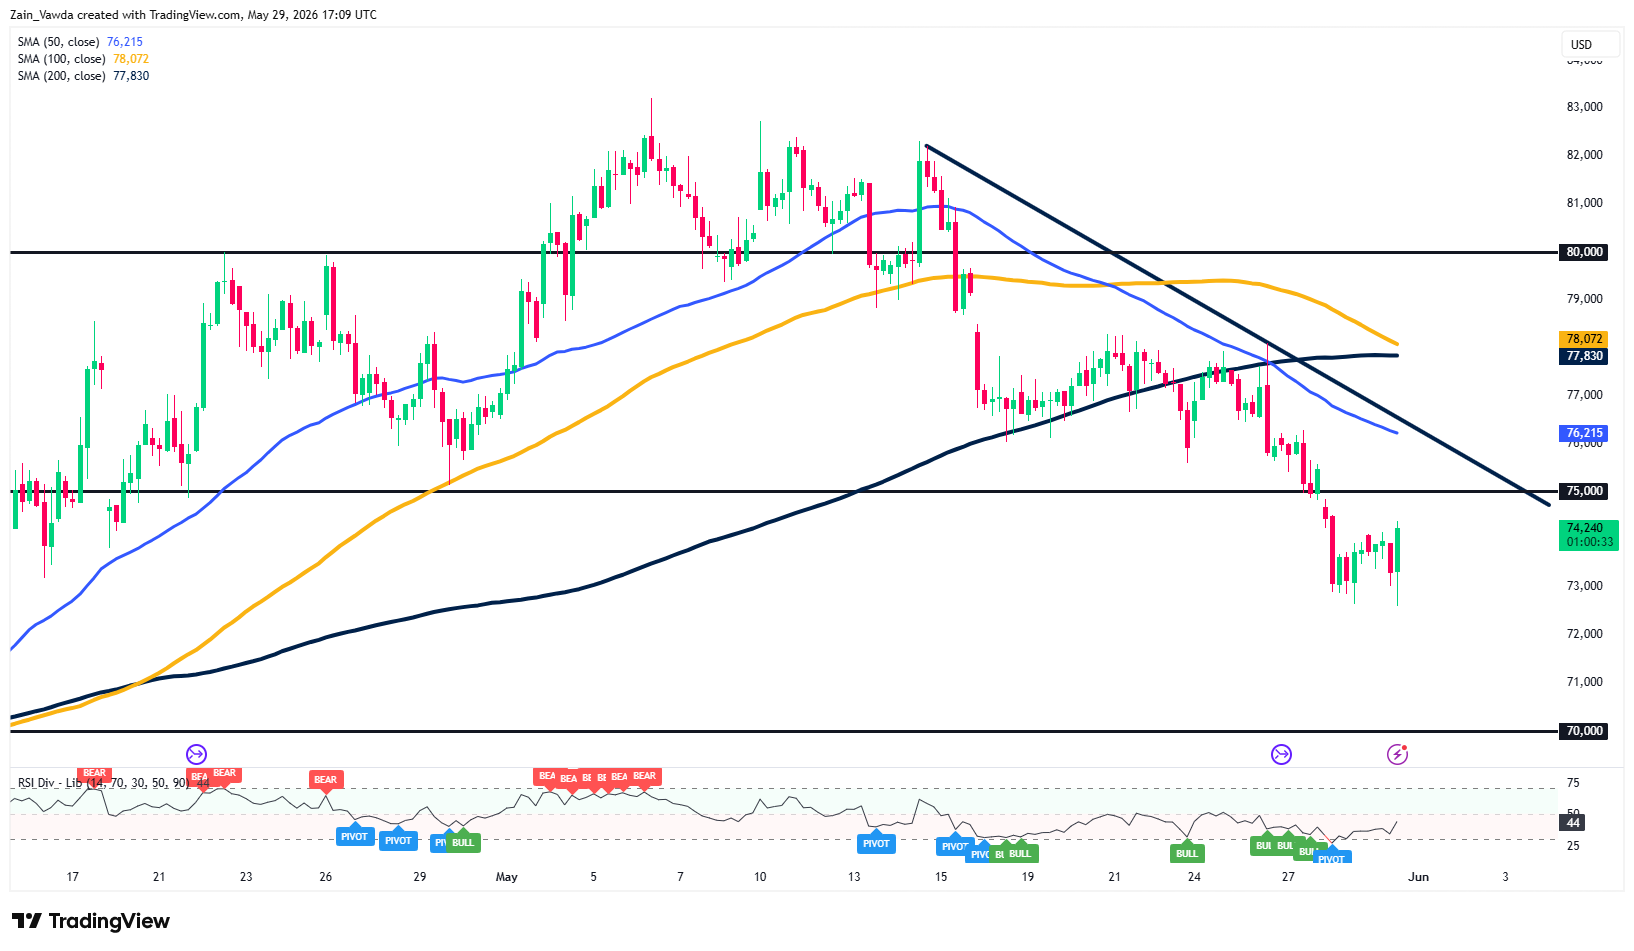
Bitcoin Four-Hour Chart, May 29, 2026
Source: TradingView
Key Technical Observations:
- Trend & Moving Averages: Price action remains below a descending trendline drawn from mid-May highs. Crucially, BTC is trading below its 50, 100, and 200 day Moving Averages (MAs).
- Support & Resistance: After breaching psychological support at $75,000, price found local support near $72,500. It is currently attempting a minor relief bounce back toward $75,000.
- RSI: The Relative Strength Index sits at 44, recovering slightly from oversold territory near 25. This leaves room for minor upward consolidation before further downside pressure.
If the relief rally fails to reclaim $75,000, expect a continuation down toward the major macro support floor at $70,000.
Read Next: RBOB Gasoline Futures Near Bear Market: Deescalation Trade or Consumer Cracking?


