Bitcoin traded near $63,600 on Tuesday, pinned inside a narrowing range even after June CPI delivered the kind of downside inflation surprise crypto bulls have spent months waiting for.
Headline CPI fell 0.4% on the month, the largest decline since April 2020 dragging the annual rate to 3.5% against a 3.8% consensus, while core CPI printed flat month-on-month and slid to 2.6% year-on-year from 2.9%.
Treasury yields eased and the dollar softened on the release. Bitcoin's response: a cautious drift toward $63,000, still shy of every major moving average.
The Macro Tailwind Nobody Can Trade
The CPI print vaporised the near-term hike trade. Fed funds futures came into the session pricing roughly 30bp of hikes this year, with a July move rising to near 50% after Governor Christopher Waller's "signal, not noise" warning on Monday.
A flat core reading the smallest since January 2021, with shelter at its softest since the same month, cuts directly against the nine 2026 dots calling for a hike. That is mechanically bullish for a long-duration, non-yielding asset.
Yet BTC remains below its 50, 100 and 200-day MAs at $64,314, $70,626 and $73,628, with daily RSI at 46. The tape is telling you the constraint is flow, not policy.
The Flow Problem
US spot Bitcoin ETFs bled $424,7 million on Monday, erasing the prior week's $197.4 million inflow, an inflow that had itself only just snapped eight consecutive weeks of redemptions, led by BlackRock's IBIT at $291.9 million.
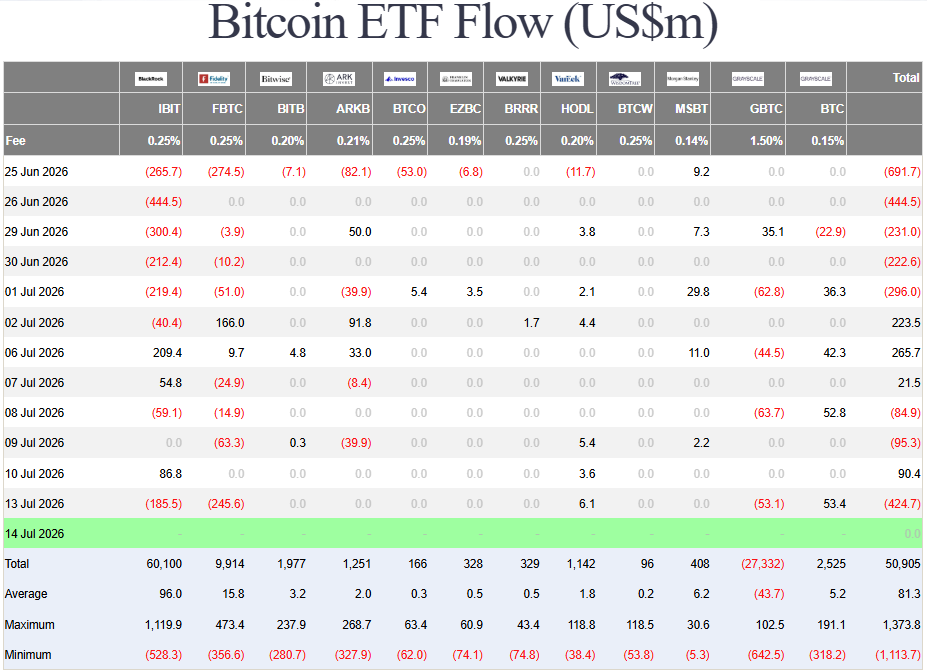
Source: Farside Investors
Institutional demand is best described as cautious rather than committed.
Derivatives positioning sharpens the picture: CoinGlass heatmap data shows dense liquidation liquidity at $61,000–$61,500 below price and $64,800–$65,000 above it, leaving BTC trapped between two magnet zones with macro headlines deciding which gets tested first.
Monday's 1.84% dip was a futures-led flush, long liquidations outpacing shorts six-to-one.
Washington: The Other Catalyst
The CLARITY Act remains parked on the Senate calendar with no floor vote scheduled, stalled on ethics and stablecoin provisions ahead of the August 7 recess.
President Trump urged passage on Monday in honour of the late Senator Lindsey Graham, and the House holds a field hearing Friday to align the two chamber versions. Passage odds have slipped toward 40–50% from over 80% in February, a decline that has tracked BTC's own drawdown.
Citi's $143,000 and Standard Chartered's $150,000 targets are explicitly conditional on the bill clearing; treat them as scenario ceilings, not base cases.
Technical Outlook - Bitcoin Futures
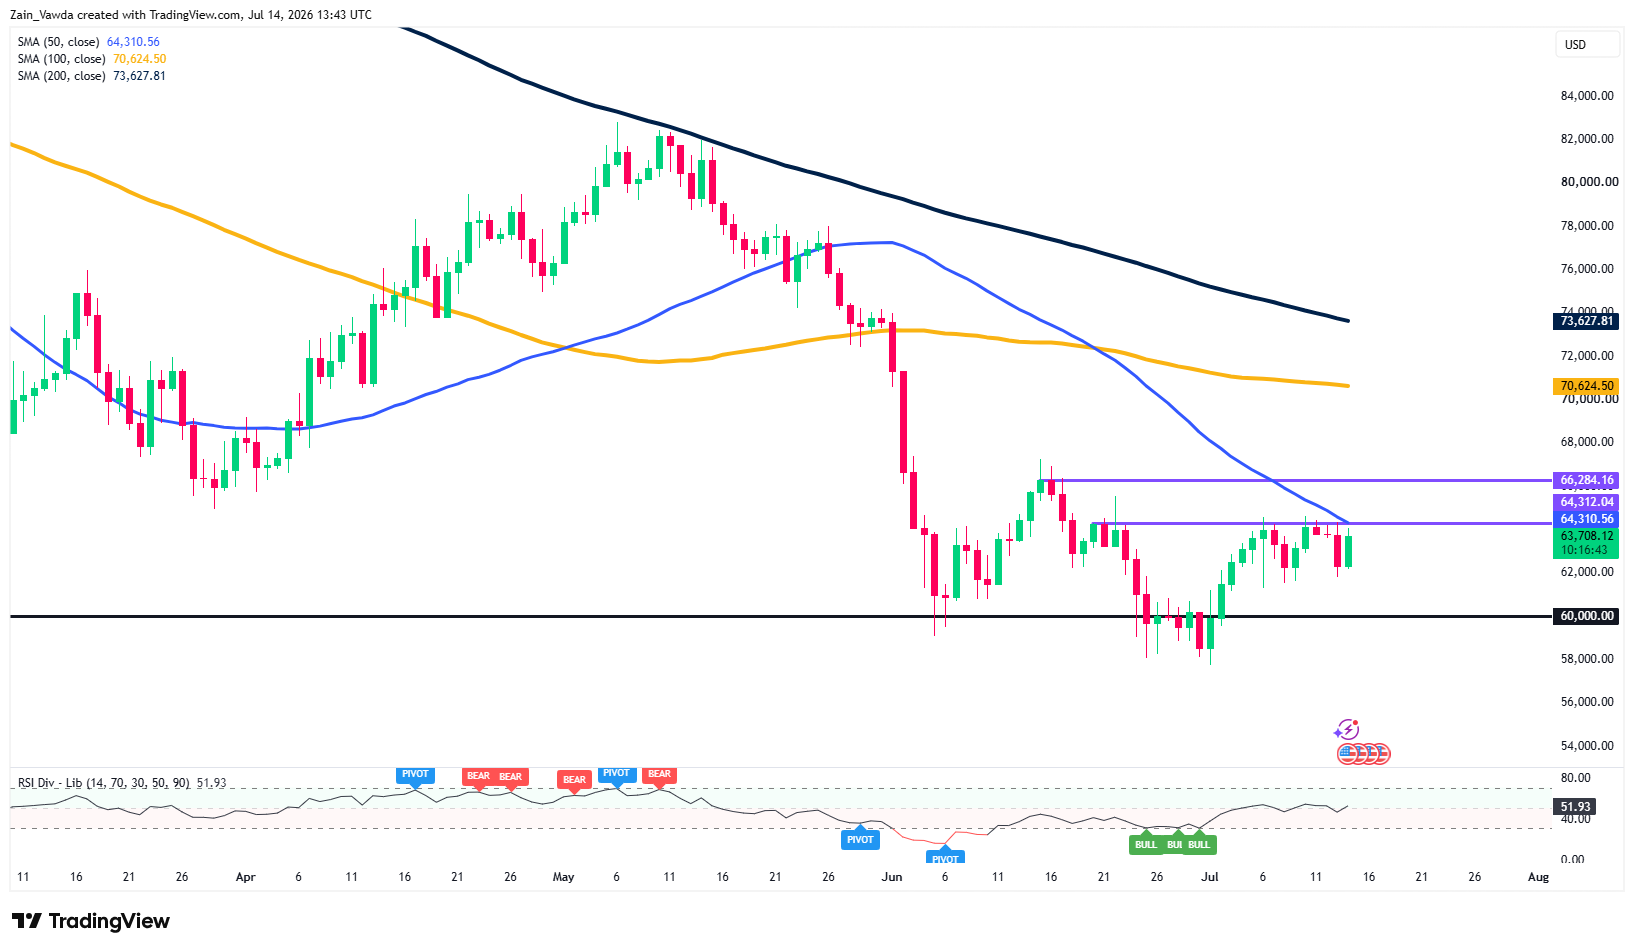
Bitcoin is stalling at 63,700, capped by a confluence of the declining 50-day MA (64,310) and horizontal resistance at 64,312 — a level rejected multiple times through July.
Bitcoin Four-Hour Chart, July 14, 2026
Source: TradingView
The broader structure remains bearish, with price trading well below the 100-day (70,624) and 200-day (73,627) SMAs, both sloping lower after June's breakdown from 76,000.
The recovery off the late-June double-bottom near 58,000–60,000 has stalled precisely at this resistance cluster, while RSI at 52 sits neutral, offering no directional edge.
A daily close above 64,312 would open the path toward 66,284, the June swing high.
Failure here keeps the 60,000 psychological floor in focus, with a break below exposing 58,000 and a resumption of the downtrend.


