
A trio of economic reports released Thursday morning relayed mixed messages for the U.S. economy, which is navigating a challenging geopolitical and macroeconomic environment.
Weekly jobless claims remained muted around recent levels, while a regional manufacturing survey showed worsening current situation, although the future promises to be less negative.
Following the data, the E-Mini S&P 500 (ES) futures sustained its losses, while the U.S. Dollar Index (DX) futures initially pared some of its gains but have recovered since.
Labor Market Holds Firm as Jobless Claims Fall
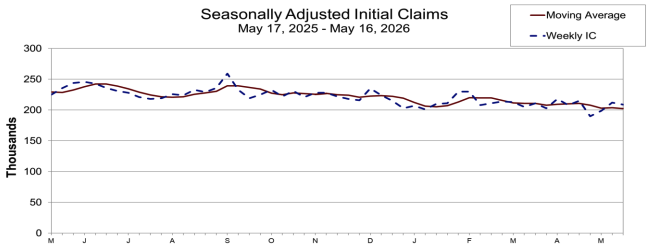
The number of individuals claiming unemployment benefits fell to 209,000 in the week ended May 16, from the revised reading of 212,000 for the previous week, according to a report released by the Bureau of Labor Statistics. Economists had expected a more modest drop to 210,000 from the initially reported 211,000 for the previous week.
The four-week average that smooths out volatility, came in at 202,500 from the previous week’s revised average of 204,000 (revised up from 203,750).
Weekly Jobless Claims
Source: Bureau of Labor Statistics
Continuing claims, calculated with a week’s lag, however climbed to 1.782 million in the week ended May 9, up 6,000 from the previous week’s revised reading of 1.776 million (revised down from 1.782 million). This metric tracks the total number of people who have already filed an initial unemployment claim and were currently receiving ongoing weekly unemployment benefits.
Manufacturing Snaps Four-Month Winning Streak
The Philadelphia Federal Reserve’s May manufacturing survey showed that manufacturing activity in the region weakened. The headline diffusion index for current general activity fell to -0.4 in May from 26.7 April, snapping a four-month expansion streak. A reading below 0 indicates contraction in activity.
Here’s how the other current indices fared:
- The shipments index declined 29 points to 4.9.
- The new orders index fell 35 points to -1.7, its lowest reading since April 2025.
- The employment index rose 2 points, although remaining negative at -2.8 in May, its third negative reading in four months.
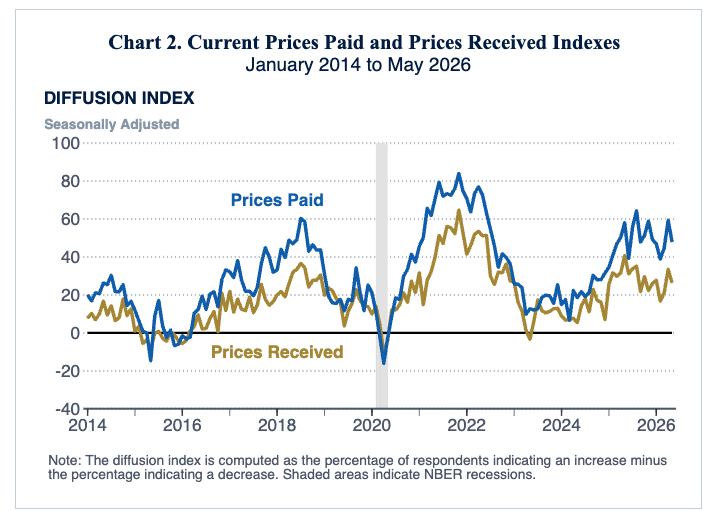
- Both price indexes declined but remained above their long-run nonrecession averages: The prices paid index fell 11 points to 47.9 in May; The prices received index declined 7 points to 26.3.
Source: Philadelphia Fed
On a positive note, most future indicators strengthened further. The diffusion index for future activity climbed 12 points to 53.3, marking the highest reading since June 2021. Firms continue to expect employment to increase to improve over the next six months, although at a slower rate.
Pricing pressure is expected to worsen further:
- Future prices paid index jumped 20 points from 70, its highest reading since Nov. 2025.
- The future prices received index moved up from 50.2 to 60.5.
- That said, the index for future capital expenditures declined 4 points to 30.9.
The results, however, contrasted with the New York Fed’s May survey, which showed manufacturing expanding at a much faster pace than anticipated in May.
Separately, the Census Bureau reported housing starts fell 2.8% month over month (MoM) to a seasonally adjusted annual rate of 1.465 million units. On a year-over-year (YoY) basis, housing starts climbed 4.5%.
Single-family starts, which accounted for roughly 64% of the total, declined 9% MoM.
Building permits, a leading indicator of future housing starts, climbed 5.8% MoM but edged down 0.2% YoY to a seasonally adjusted annual rate of 1.442 million units.
Read Next: The 50K Test: Economic Data and Nvidia's Aftermath Set Up a Volatile Day for Dow Jones Futures