As a new month kicks off, the S&P 500 is trading near all-time highs, prompting traders to ask the age-old summer question: Is it time to take profits, or will the bull market keep charging?
While a heavy macro schedule and shifting geopolitical headlines are introducing short-term volatility, technical and historical data suggest the benchmark index may have plenty of runway left for the month ahead.
Goldman Sachs Sentiment: Room to Run
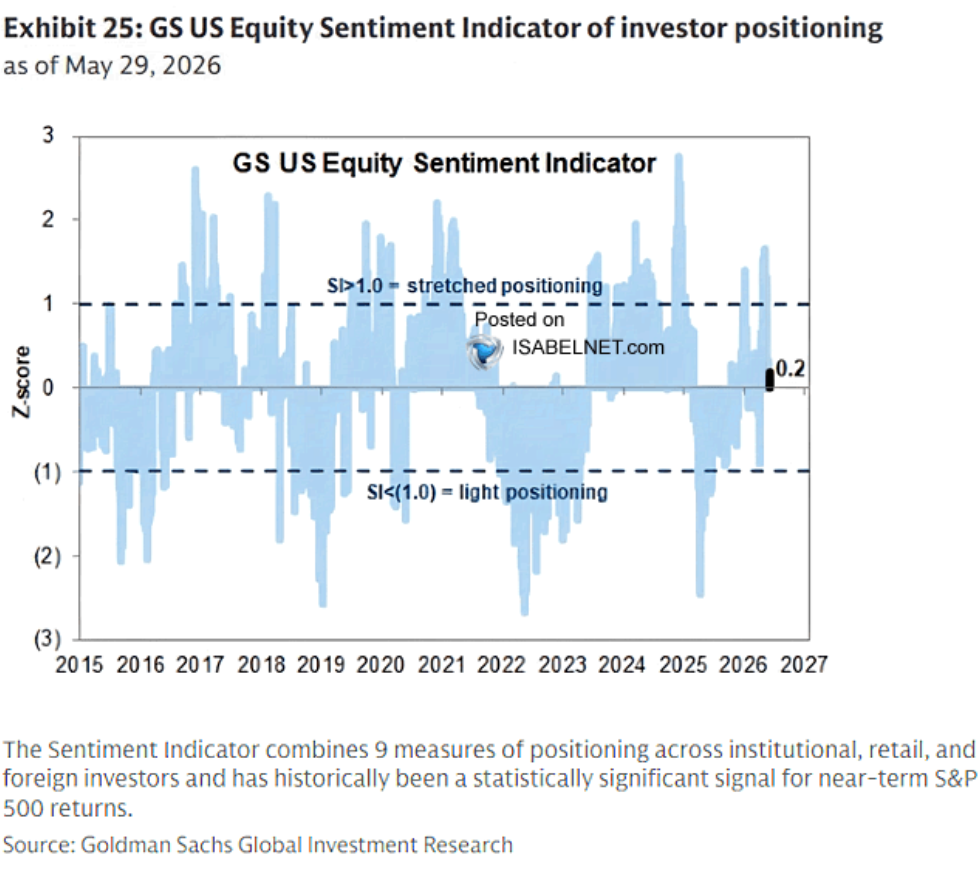
A common concern during an extended market rally is that investor positioning has become too "stretched" or greedy, leaving the index vulnerable to a sharp correction. However, recent data suggests that the market is far from a state of irrational exuberance.
Source: Goldman Sachs, IsabelNet
According to the latest Goldman Sachs Global Investment Research data, the GS US Equity Sentiment Indicator registered a Z-score of 0.2 as of May 29, 2026. This metric combines nine distinct measures of positioning across institutional, retail, and foreign investors.
At 0.2, Goldman Sachs' US Equity Sentiment Indicator sits close to neutral territory. In the past, similar readings have preceded an average 0.8% rise in the S&P 500 over the following month.
Because the indicator sits just slightly above zero, it indicates that positioning is remarkably balanced. The market is not overly crowded or overbought (which occurs when the score crosses above 1.0), meaning there is still plenty of cash on the sidelines available to drive equities higher.
June and The Power of Seasonality
While old market adages frequently warn investors to "Sell in May and go away," historical data compiled by Carson Group and FactSet reveals a completely different reality for the month of June.
Over the past decade, June has quietly established itself as one of the most reliable and bullish months of the calendar year for the S&P 500.
Source: IsabelNet
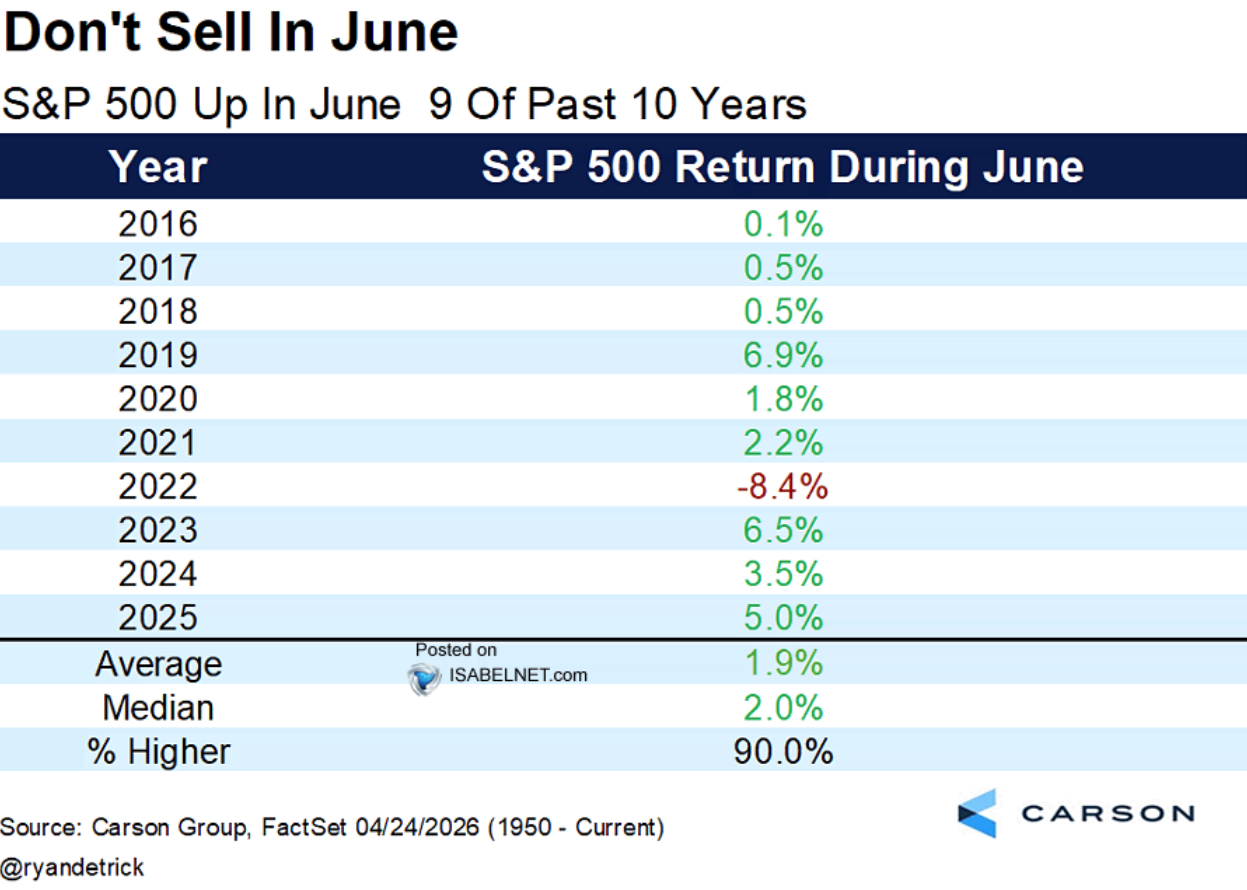
As shown in the historical performance breakdown, the S&P 500 has finished in the green in 9 of the past 10 Junes (a 90% win rate):
- The Steady Gainers: Consistent positive returns were logged in 2016 (+0.1%), 2017 (+0.5%), 2018 (+0.5%), 2020 (+1.8%), and 2021 (+2.2%).
- The Breakout Years: Blockbuster Junes occurred in 2019 (+6.9%), 2023 (+6.5%), 2024 (+3.5%), and 2025 (+5.0%).
- The Lone Outlier: The only blemish on this stellar ten-year track record was during the severe bear market of 2022, where the index dropped 8.4%.
With an average return of 1.9% and a median return of 2.0% over this ten-year span, historical seasonality strongly favors the bulls.
Near-Term Outlook for the S&P 500
As the rest of the week unfolds, the S&P 500 will test this bullish data against a gauntlet of economic releases, including the JOLTS job openings, ISM Services data, and Friday's highly anticipated May Nonfarm Payrolls report.
While individual macroeconomic data points can trigger brief intraday pullbacks, the structural backdrop remains highly encouraging.
The combination of a highly disciplined, neutral investor sentiment and a powerful 90% historical seasonal tailwind suggests that the S&P 500 is well-positioned to defy the skeptics and continue its upward trajectory through June.
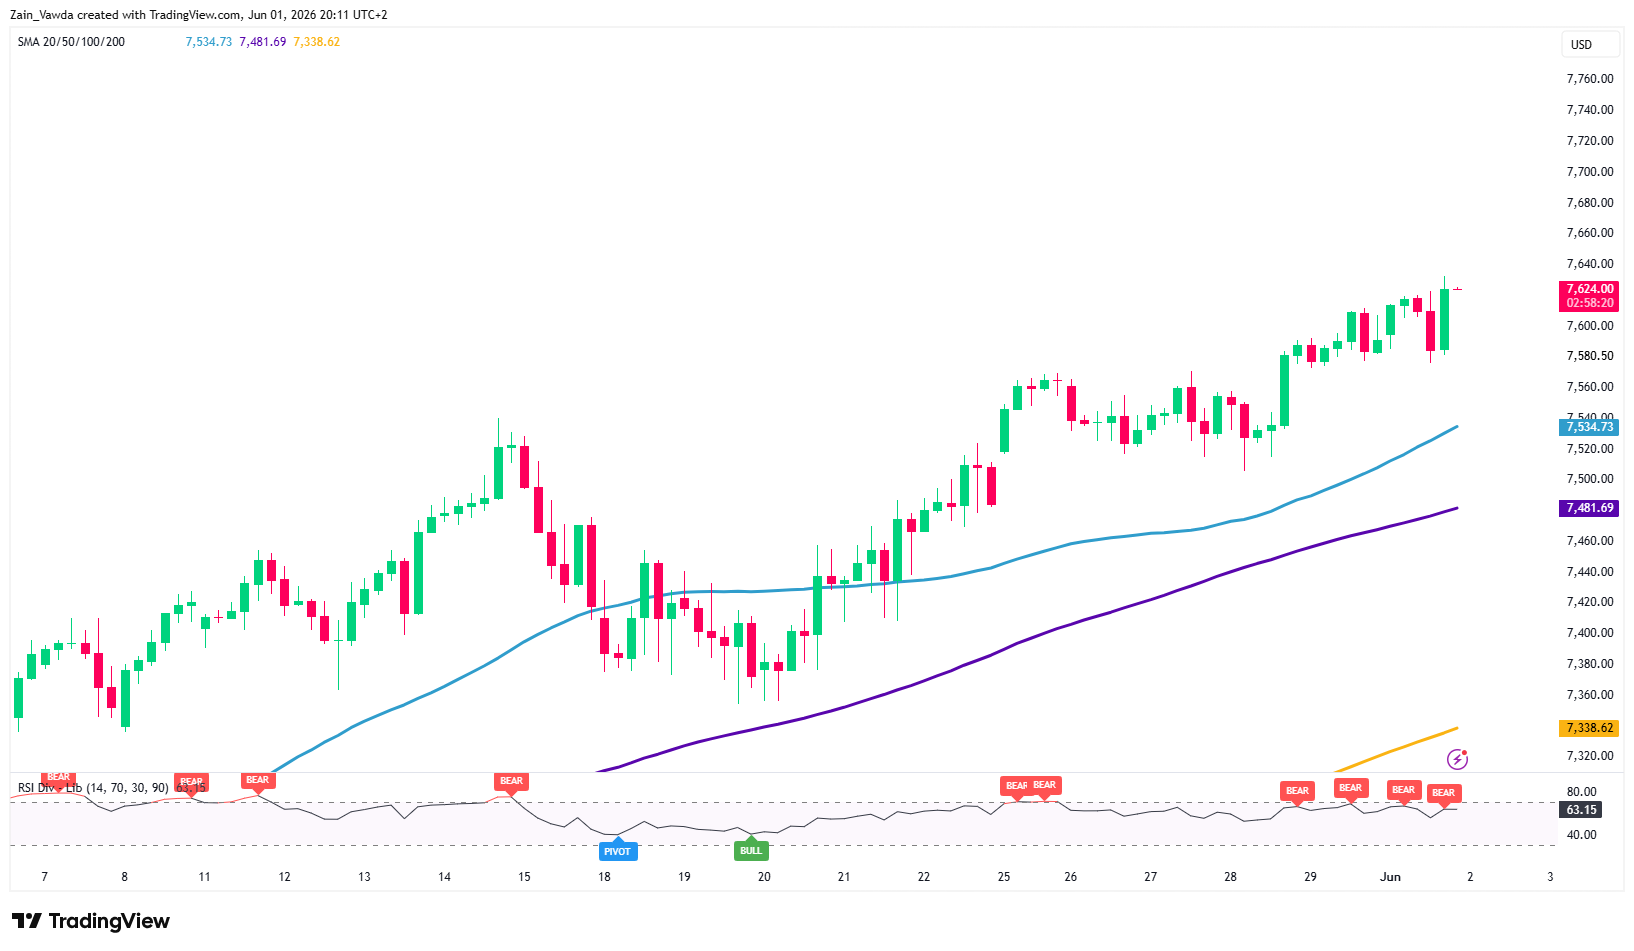
S&P 500 Futures (ES1!) Four-Hour Chart, June 1, 2026
Source: TradingView
The S&P 500 Futures (ES1!) 4-hour chart demonstrates strong bullish momentum, with price action trending well above key moving averages (MA 50 at 7,534.73 and MA 100 at 7,481.69).
The index recently formed a new high at 7,624.00, confirming a sustained uptrend.
However, the Relative Strength Index (RSI) at 63.15 highlights several consecutive "BEAR" divergence signals near the 70 overbought threshold.
This suggests that while buyers remain firmly in control, a minor near-term cooling period or technical pullback toward the 50 MA could occur before the index attempts its next leg higher.
Read Next: Is $4,000/oz for Gold Back in Play as Markets Continue 'Buy the Rumor, Sell the News' Narrative?