Crude oil moved sharply higher Tuesday. WTI rose to $84.77 a barrel, up 2.77% on the day, while Brent traded near $91.33, up roughly 2.4% from Monday's close after touching an intraday high of $91.57. Media coverage of the move attributes it to the same story that's driven oil for over a week: U.S. strikes on Iran extending to a 10th consecutive day, Tehran's retaliatory attacks on neighboring countries, President Trump's warning that Iran would be held responsible for the deaths of three U.S. service members, and a threatened maritime embargo against Saudi Arabia by Iran-backed Houthi militants, raising concern over Red Sea shipping.
Latest reports say that at least eight oil tankers, including 2 Chinese Very Large Crude Carriers (VLCC) have aborted transit through Bab EL-Mandeb following Houthi’s naval blockade against Saudi Arabia.
https://x.com/anasalhajji/status/2079557987757351128
Multiple things are moving simultaneously, and one of them has gotten conspicuously little attention set against how significant it could be.
The Story Running Underneath
Separately from the Iran-related disruptions, attacks on the Caspian Pipeline Consortium (CPC) terminal on Russia's Black Sea coast have disrupted exports from Kazakhstan, one of the world's largest crude suppliers. The CPC terminal is a critical export route for Kazakhstan's crude (exporting 80% of the country’s oil), which moves through Russian territory to reach international markets.
A sustained disruption there removes real barrels from global supply, independent of anything happening in the Gulf or the Red Sea. If the market is currently pricing oil almost entirely on Iran-related headlines while treating the Caspian disruption as background noise, that's either because traders have already concluded the Kazakh impact is minor and temporary or because it hasn't been fully absorbed into positioning yet.
Why This Is Hard to Prove Either Way
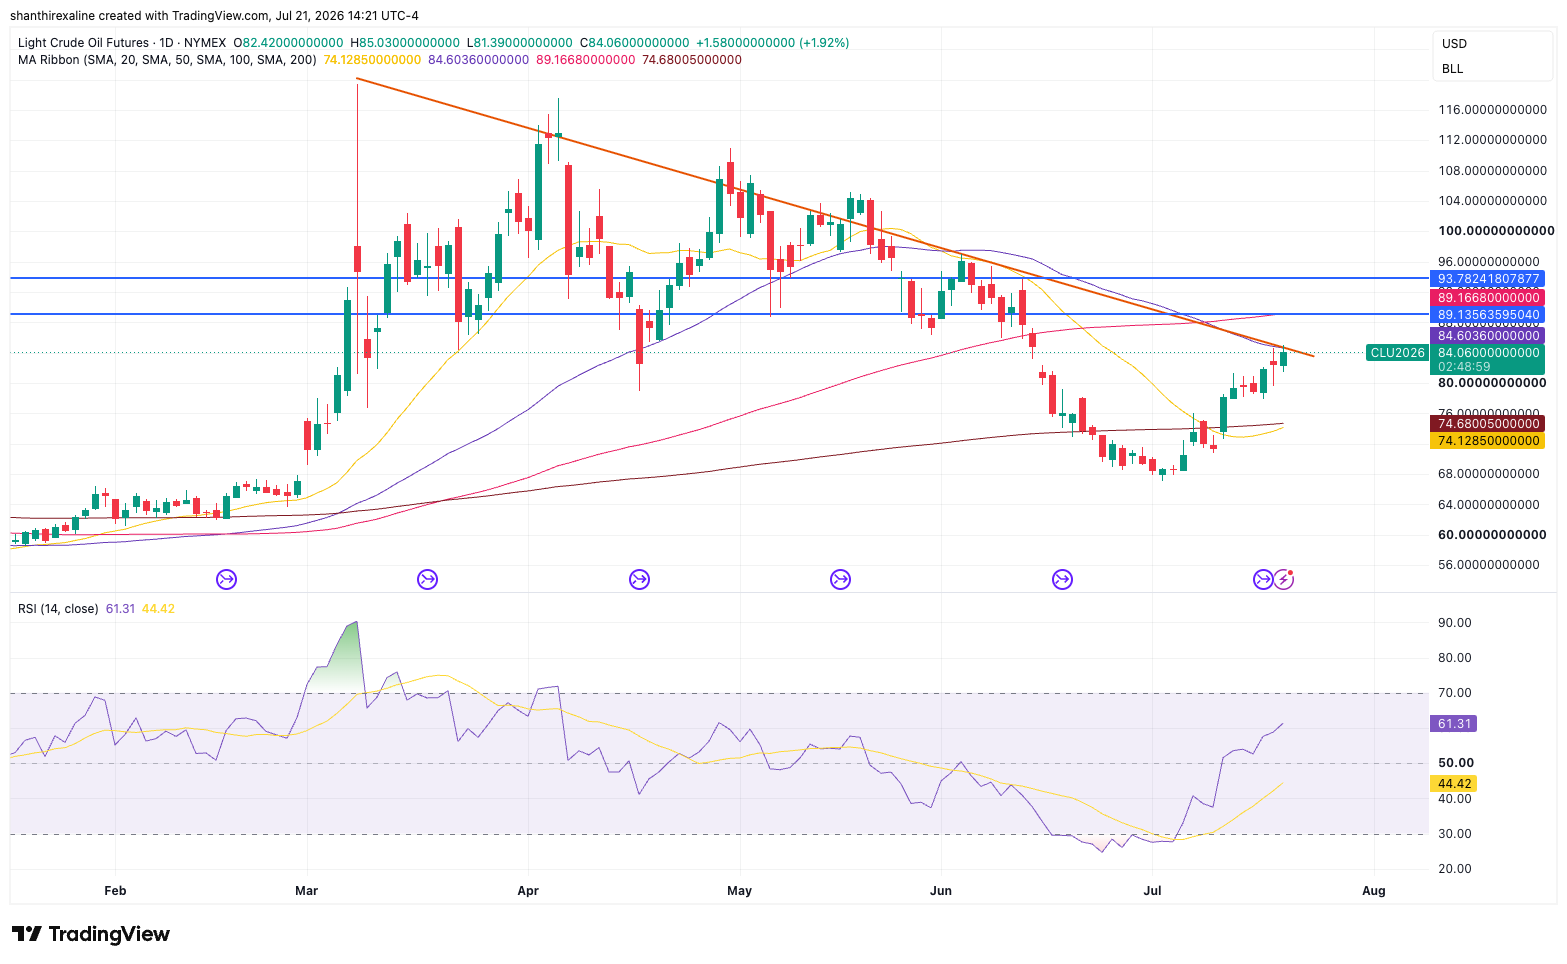
Tuesday's rally has a technical dimension. The WTI crude had already broken above a descending trendline from its March highs and was testing resistance near $83.79 before Wednesday’s headlines. This suggests some of the move plausibly reflects technical follow-through (breakout momentum, stop-loss triggers) layered on top of news flow, not purely fresh catalysts.
What Would Change That
Explicit CPC volume data. If Kazakh export flows through the terminal show a measurable, sustained drop, that's the data point that would force the market to price the disruption on its own terms rather than as a footnote to the Iran story.
A slowdown in the Iran narrative. If ceasefire mediation progresses and Iran-linked headlines stop driving daily price swings, any residual elevation in crude would become a cleaner signal of how much the Caspian disruption, or other supply factors is actually contributing.
Is the market correctly concentrating its attention on the highest-probability, highest-magnitude risk (a full Hormuz disruption), or is it under-pricing a second, quieter supply shock simply because it hasn't generated the same volume of headlines? That's not resolvable from price attribution alone — it requires tracking actual Kazakh export volumes and whether analyst commentary starts to name the Caspian disruption specifically, rather than folding it into the broader "Middle East tensions" narrative.
WTI Crude Tests the Line That's Capped Every Rally Since March
WTI on Tuesday both its 50-day moving average and the descending trendline that's capped every rally since March's $111 high. RSI at 61.31 — up sharply from oversold territory in late June — shows real momentum behind the move, not just a headline-driven pop.
Source: TradingView
A close above the trendline and a push through the $89–94 resistance band (where the 100-day average also sits) would signal the multi-month downtrend is finally breaking. Failure here likely sends price back toward the $74–75 support shelf, where the 20-day and 200-day averages currently converge — making this level the key test even as Iran-linked headlines supply the fundamental fuel for the move.
See where retail traders are positioned on crude oil with MarketFramework's Positioning Edge tool.


