
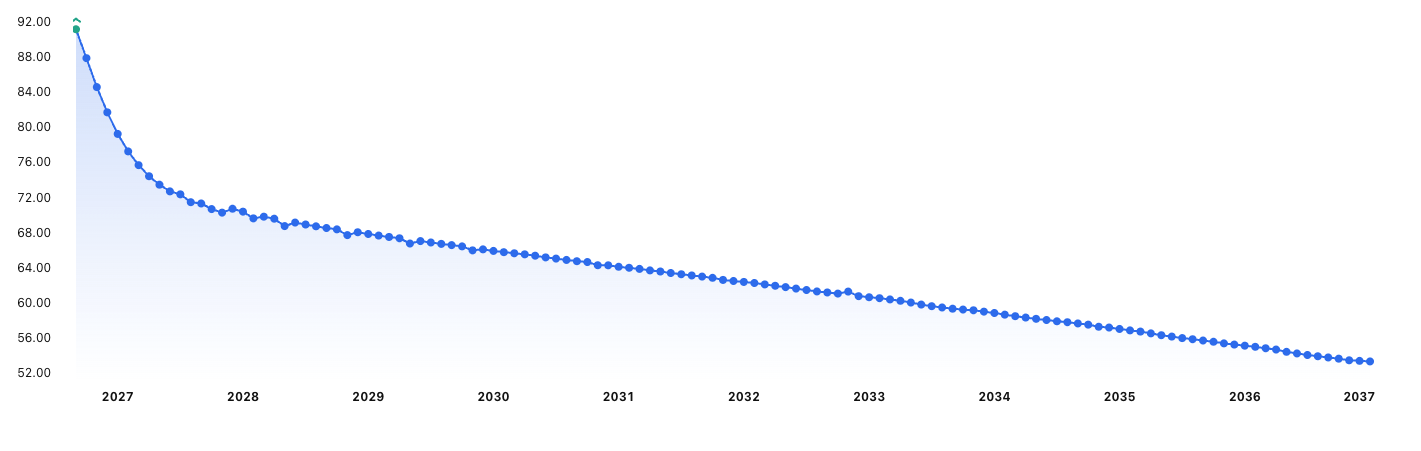
West Texas Intermediate (WTI) crude trade above $91 a barrel, but the futures curve is telling a more nuanced story. October WTI is trading at $91.40, compared with $88.02 for November and $84.63 for December. That creates a nearly $7 premium between October and December, a steep backwardation that highlights just how much the market is paying for barrels available now.
The setup captures the central tension in the oil market: near-term supply is tight, but traders are not pricing today's disruption as a permanent shortage.
That distinction has become increasingly important as renewed U.S.-Iran fighting threatens oil flows through the Strait of Hormuz. WTI traded in an $89.57-$93.14 range, as tensions intensified, while reports pointed to sharply reduced tanker traffic through the strategic waterway.
The front of the curve is screaming supply stress
The October contract is carrying the biggest geopolitical premium.
At $91.40, October WTI sits $6.77 above December. November is already $3.38 below October, showing that the market expects some of today's extreme tightness to ease as the delivery window moves further out.
Forward Curve in Backwardation
Source: TradingView
That is what makes the curve more informative than the headline price alone.
Backwardation occurs when prompt crude (immediately available for near-term physical delivery) trades above later deliveries, typically reflecting tight immediate supply relative to demand. For physical-market participants, it can signal that barrels are more valuable today than they are expected to be in the future.
And right now, the premium is concentrated heavily in the front of the curve.
$7 is the number traders should watch
The October-to-December spread is now a useful gauge of geopolitical stress.
If the spread widens beyond $7, it would suggest traders are placing an even larger premium on immediate supply. That could happen if Hormuz disruptions intensify, tanker traffic falls further or physical inventories continue tightening.
But if the spread compresses sharply while October WTI remains elevated, the message would be different: the market may be beginning to look through the immediate supply shock.
That would be an early warning that the rally is becoming less about structural scarcity and more about a temporary geopolitical premium.
Why $84.63 matters
December WTI at $84.63 provides an important reality check against the $91.40 October contract.
The market is effectively saying that if supply conditions normalize, crude does not necessarily need to remain near $90. The further-out price is already reflecting a meaningful retreat from the current front-month premium.
That does not make a move near $92 bearish. In fact, persistent backwardation can be a powerful bullish signal because it indicates immediate physical tightness.
The key is whether that tightness persists long enough to migrate further down the curve.
The risk is that the curve starts moving higher
For oil bulls, the biggest threat to the “temporary shock” interpretation would be a sustained repricing of November and December.
If November moves decisively toward $90 while December climbs toward $87-$88, the curve would be signaling that supply stress is no longer confined to October.
That would transform the story from “a short-term geopolitical premium” into “a prolonged supply disruption.”
And that is where the bullish case for crude becomes considerably stronger.
The market is pricing two different futures
For now, the curve is telling traders to separate the next few weeks from the months beyond them.
October at $91.40 reflects the market's anxiety over immediate barrels. December at $84.85 reflects the belief that some combination of restored flows, alternative supply and changing geopolitical conditions can eventually relieve that pressure.
The $7 backwardation between the two contracts is therefore more than a technical feature of the futures curve. It is the market's current estimate of how much today's oil shock is worth.
If that spread keeps widening, $92 may be only an intermediate stop.
If it starts collapsing, the curve could be warning that the oil rally has already priced much of the immediate supply risk.
MarketFramework’s Top Traded Contract tool shows traders broadly neutral toward CL, with 56% of winning trades positioned long versus 60% of losing trades. The narrow gap suggests there is no strong directional edge in positioning, while the heavier long exposure among losers offers a mild contrarian warning for crude bulls: traders leaning long have not had a clear advantage as the market hovers around $92.


